IELTS Writing Task 1 yêu cầu thí sinh mô tả biểu đồ cột về số lượng người tham gia bảo hiểm nhân thọ trong ba tháng tại ba công ty bảo hiểm nhân thọ khác nhau. Bài viết cần nêu rõ sự khác biệt và xu hướng trong số liệu, bao gồm số người tham gia tăng hay giảm theo từng tháng và so sánh giữa các công ty. Phân tích chi tiết và mạch lạc sẽ giúp đạt điểm cao hơn.
Đọc bài này Cách làm bài IELTS Writing Task 1 Bar Chart trước khi làm bài.
Bạn cũng có thể đọc lại bài nói về Task 1 tại đây: IELTS Writing Task 1 cần lưu ý những gì?
Đọc thêm về xây dựng lộ trình học IELTS của The Real IELTS.
IELTS Writing Task 1 Bar Chart: Life Insurance
You should spent about 20 mintutes on this task
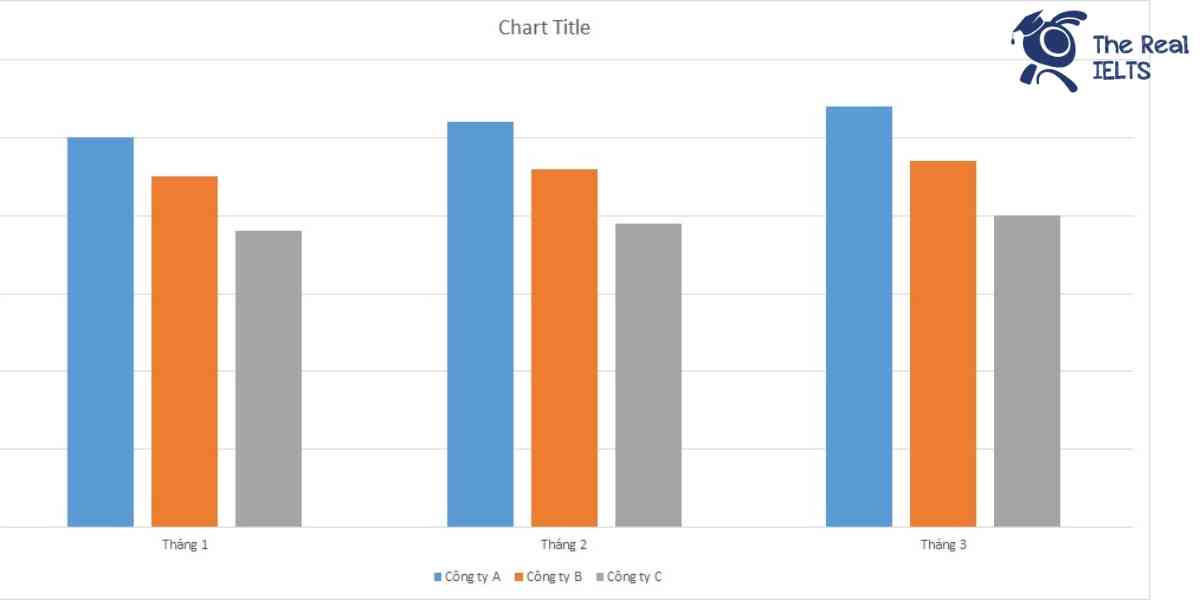
IELTS Writing Task 1 requires candidates to describe a bar chart illustrating the number of people participating in life insurance over three months at three different life insurance companies. The essay should highlight the differences and trends in the data, including whether the number of participants increases or decreases each month and comparisons between the companies. Detailed and coherent analysis will help achieve higher scores.
You should write at least 150 words.
| Tháng | Công ty A | Công ty B | Công ty C |
| Tháng 1 | 5,000 | 4,500 | 3,800 |
| Tháng 2 | 5,200 | 4,600 | 3,900 |
| Tháng 3 | 5,400 | 4,700 | 4,000 |

Bài mẫu 1
Overview
The data provided represents the number of participants in life insurance from three different companies—Company A, Company B, and Company C—over three months. The figures highlight the growth trends in participant numbers for each company, illustrating varying rates of increase.
Body 1: Monthly Participation Trends
In January, the data shows that Company A had the highest number of participants at 5,000, followed by Company B with 4,500, and Company C with 3,800. This ranking remained consistent in February and March. However, all companies experienced a gradual increase in participant numbers over these months. By February, Company A saw an increase of 200 participants, reaching 5,200. Company B increased by 100 participants, totaling 4,600, while Company C added 100 participants, reaching 3,900.
Body 2: Comparative Analysis and Trends
March continued this upward trend, with Company A leading at 5,400 participants. Company B and Company C followed with 4,700 and 4,000 participants, respectively. This steady growth across all companies suggests a positive market trend for life insurance, potentially driven by increasing awareness or changing economic factors. Company A consistently outperformed the others, showing a notable ability to attract more participants, while Company C, despite being the smallest in terms of participant numbers, demonstrated a steady growth trajectory.
Overall, the data indicates a healthy competitive environment in the life insurance sector, with all companies expanding their participant bases over the observed period.
Bài mẫu 2
Overview
The data provided represents the number of participants in life insurance from three different companies—Company A, Company B, and Company C—over three months. The figures highlight the growth trends in participant numbers for each company, illustrating varying rates of increase.
Body 1: Monthly Participation Trends
In January, the data shows that Company A had the highest number of participants at 5,000, followed by Company B with 4,500, and Company C with 3,800. This ranking remained consistent in February and March. However, all companies experienced a gradual increase in participant numbers over these months. By February, Company A saw an increase of 200 participants, reaching 5,200. Company B increased by 100 participants, totaling 4,600, while Company C added 100 participants, reaching 3,900.
Body 2: Comparative Analysis and Trends
March continued this upward trend, with Company A leading at 5,400 participants. Company B and Company C followed with 4,700 and 4,000 participants, respectively. This steady growth across all companies suggests a positive market trend for life insurance, potentially driven by increasing awareness or changing economic factors. Company A consistently outperformed the others, showing a notable ability to attract more participants, while Company C, despite being the smallest in terms of participant numbers, demonstrated a steady growth trajectory.
Overall, the data indicates a healthy competitive environment in the life insurance sector, with all companies expanding their participant bases over the observed period.