IELTS Writing Task 1 yêu cầu bạn phân tích biểu đồ thanh thể hiện chi phí sinh hoạt cá nhân của ba nhân viên văn phòng trong ba tháng. Bạn cần mô tả và so sánh các mức chi phí giữa ba người này, tập trung vào các yếu tố chính như tiền thuê nhà, ăn uống, và chi phí đi lại. Sử dụng các số liệu từ biểu đồ để minh họa sự khác biệt và xu hướng.
Đọc bài này Cách làm bài IELTS Writing Task 1 Bar Chart trước khi làm bài.
Bạn cũng có thể đọc lại bài nói về Task 1 tại đây: IELTS Writing Task 1 cần lưu ý những gì?
Đọc thêm về xây dựng lộ trình học IELTS của The Real IELTS.
IELTS Writing Task 1 Bar Chart: Living Expenses
You should spent about 20 mintutes on this task
IELTS Writing Task 1 requires you to analyze a bar chart showing the personal living expenses of three office employees over three months. You need to describe and compare the expense levels among these three individuals, focusing on key factors such as rent, food, and travel costs. Use the data from the chart to illustrate the differences and trends.
You should write at least 150 words.
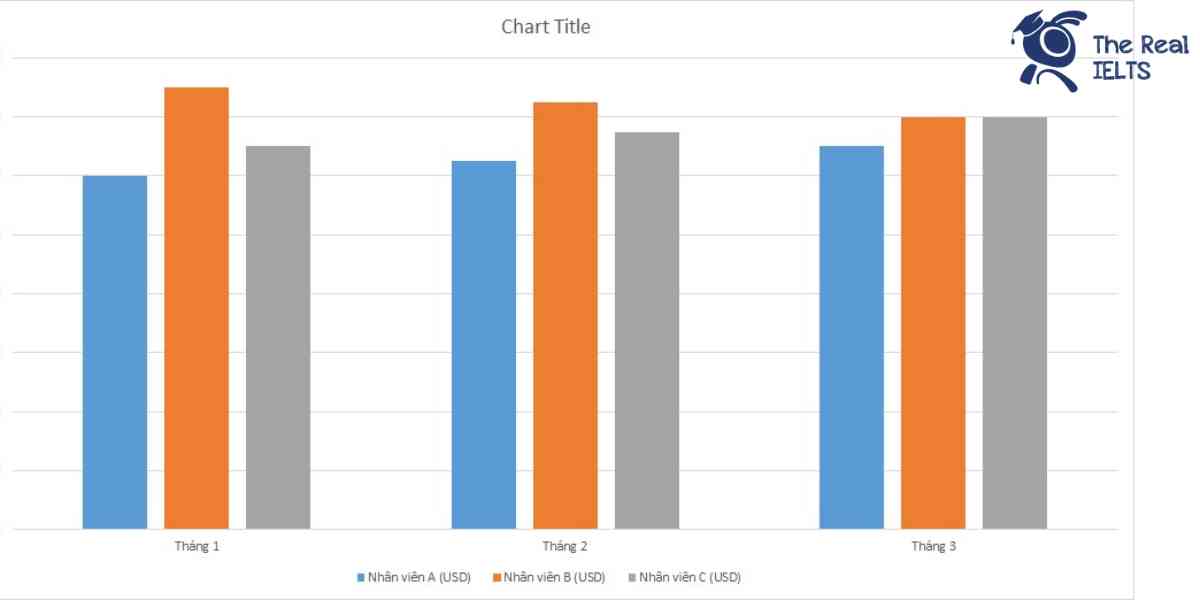
| Tháng | Nhân viên A (USD) | Nhân viên B (USD) | Nhân viên C (USD) |
| Tháng 1 | 1,200 | 1,500 | 1,300 |
| Tháng 2 | 1,250 | 1,450 | 1,350 |
| Tháng 3 | 1,300 | 1,400 | 1,400 |

Bài mẫu số 1
Overview
The following report presents an analysis of the living expenses of three office employees over a period of three months. The expenses of each employee were recorded monthly, and the data has been illustrated using a bar chart. This analysis aims to provide insight into the cost of living trends for each employee and how their expenses have changed over time.
Body 1
In January, Employee A’s living expenses were $1,200, while Employee B spent $1,500, and Employee C spent $1,300. Employee B had the highest expenses among the three, possibly due to higher rent or other living costs. Employee A had the lowest expenses, which could be attributed to more economical living choices or lower rent.
In February, there was a slight increase in the living expenses for all three employees. Employee A’s expenses rose to $1,250, while Employee B’s expenses decreased to $1,450, and Employee C’s expenses increased to $1,350. The decrease in Employee B’s expenses might suggest cost-saving measures or reduced spending, whereas the increases for Employees A and C indicate higher living costs or additional expenditures.
Body 2
By March, Employee A’s expenses had increased further to $1,300, showing a consistent upward trend over the three months. Employee B’s expenses continued to decline, reaching $1,400. This consistent reduction might indicate a successful effort in managing and reducing living costs. On the other hand, Employee C’s expenses increased to $1,400, aligning with Employee B’s expenses for the month.
Overall, the data reveals that while Employee A experienced a steady rise in living expenses, Employee B successfully managed to reduce their costs over the three months. Employee C’s expenses showed a gradual increase, indicating a potential rise in living costs or additional spending. This analysis can help in understanding personal finance trends and in planning future budgets effectively.
Bài mẫu số 2
Overview
The following analysis provides a comparative overview of the living expenses of three office employees, A, B, and C, over three months. The expenses are presented in USD and depicted in a bar chart, which illustrates the fluctuations and trends in their spending patterns.
Body 1
In January, Employee A had the lowest living expenses, amounting to $1,200. Employee B spent the most at $1,500, while Employee C’s expenses were $1,300. This month indicates a notable variation, particularly between Employees A and B, with a $300 difference.
Moving into February, Employee A’s expenses rose to $1,250, an increase of $50. Employee B’s expenses slightly decreased to $1,450, showing a $50 reduction. Employee C also saw a modest increase in their expenses, rising to $1,350. The gap between the highest and lowest spenders narrowed this month.
Body 2
By March, Employee A’s expenses had increased further to $1,300, maintaining a consistent upward trend over the three months. Employee B continued a downward trend, spending $1,400. Employee C’s expenses also rose to $1,400, matching Employee B for the first time. This resulted in a convergence in spending levels, with all three employees’ expenses becoming more aligned by the end of the period.
Overall, the data reflects a gradual increase in living expenses for Employees A and C, while Employee B’s expenses decreased slightly each month. The convergence in March suggests a stabilization of living costs among the three employees.