IELTS Writing Task 1 yêu cầu mô tả biểu đồ Bar Chart minh họa số lượng sản phẩm mới ra mắt trong 3 tháng của ba công ty khác nhau. Bạn cần phân tích số liệu, so sánh sự khác biệt và xu hướng giữa các công ty, sử dụng ngôn ngữ chính xác và phong phú. Bài viết phải có cấu trúc rõ ràng, gồm phần giới thiệu, thân bài và kết luận.
Đọc bài này Cách làm bài IELTS Writing Task 1 Bar Chart trước khi làm bài.
Bạn cũng có thể đọc lại bài nói về Task 1 tại đây: IELTS Writing Task 1 cần lưu ý những gì?
Đọc thêm về xây dựng lộ trình học IELTS của The Real IELTS.
IELTS Writing Task 1 Bar Chart: New Products
You should spent about 20 mintutes on this task
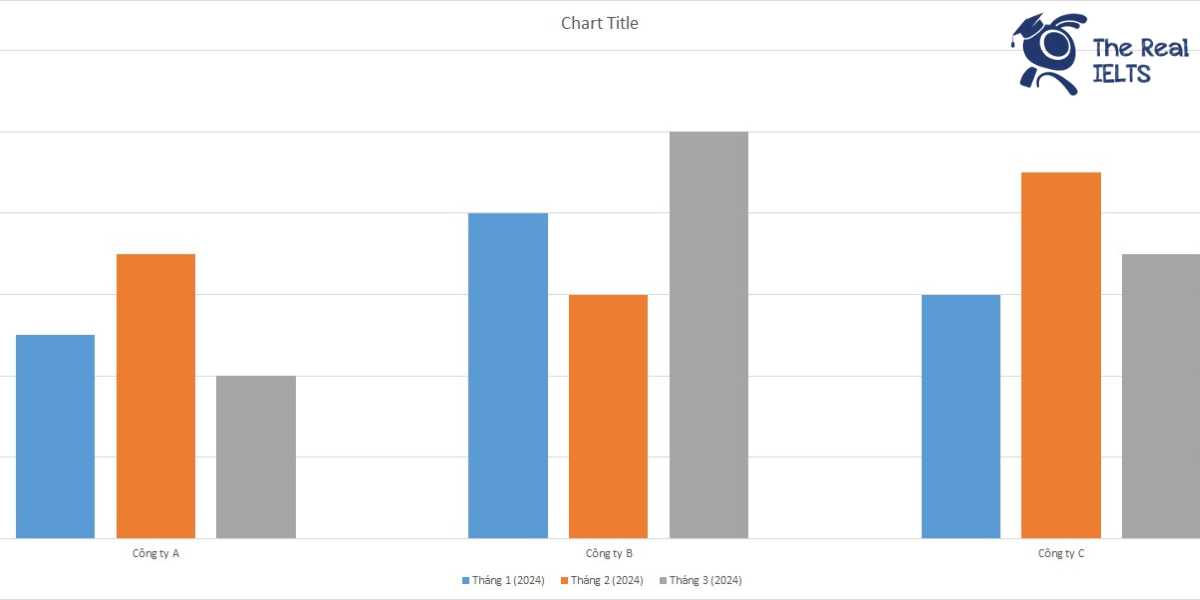
IELTS Writing Task 1 requires describing a Bar Chart illustrating the number of new products launched over three months by three different companies. You need to analyze the data, compare differences and trends among the companies, using precise and rich language. The essay should have a clear structure, including an introduction, body paragraphs, and a conclusion.
You should write at least 150 words.
| Tháng | Công ty A | Công ty B | Công ty C |
| Tháng 1 (2024) | 5 | 8 | 6 |
| Tháng 2 (2024) | 7 | 6 | 9 |
| Tháng 3 (2024) | 4 | 10 | 7 |

Bài mẫu 1
Overview
This report presents a comparative analysis of the number of new products launched by three different companies—Company A, Company B, and Company C—over a three-month period. The data provided spans January, February, and March, detailing the frequency and trends in product launches for each company.
Body 1: Monthly Product Launches
In January, Company A introduced 15 new products, Company B launched 10, and Company C led with 20 new products. This indicates a strong start for Company C, outperforming its competitors. In February, Company A saw a slight decrease with 12 new products, while Company B increased its output to 15 new products. Company C launched 18 new products, showing a consistent high performance. By March, all companies showed significant activity: Company A released 20 new products, Company B launched 18, and Company C introduced 25 new products, marking the highest number in this period.
Body 2: Comparative Analysis and Trends
Examining the data across these three months, Company C consistently led in the number of new product launches, indicating a robust product development strategy. Company A experienced fluctuations but ended strongly in March, matching Company C’s January performance. Company B showed a steady increase in its product launches, reflecting a gradual but consistent improvement in its output. The trends suggest that while Company C maintained its lead, Company A and Company B are also competitive, with notable increases in March. This analysis highlights the dynamic nature of product development and the varying strategies of each company in responding to market demands.
Bài mẫu 2
Overview: Overall, Company C consistently released the highest number of new products each month, while Company A and Company B exhibited varying trends. The data indicates an upward trend in product launches for all three companies from January to March.
Body 1: In January, Company C led the new product launches with 20 products, followed by Company A with 15, and Company B with 10. In February, Company B saw an increase in its product launches, reaching 15 products, surpassing Company A, which released 12 new products. Despite a slight decrease, Company C maintained its lead with 18 new products in February.
Body 2: By March, all three companies showed an increase in the number of new products launched. Company A experienced a significant rise, introducing 20 new products, equal to its output in January. Company B also continued its upward trend, releasing 18 new products. Company C further solidified its lead with 25 new products, the highest number across all months and companies.
In conclusion, the data illustrates that Company C was the most prolific in launching new products, while Company A and Company B showed varying but generally increasing trends in their new product releases over the three-month period.