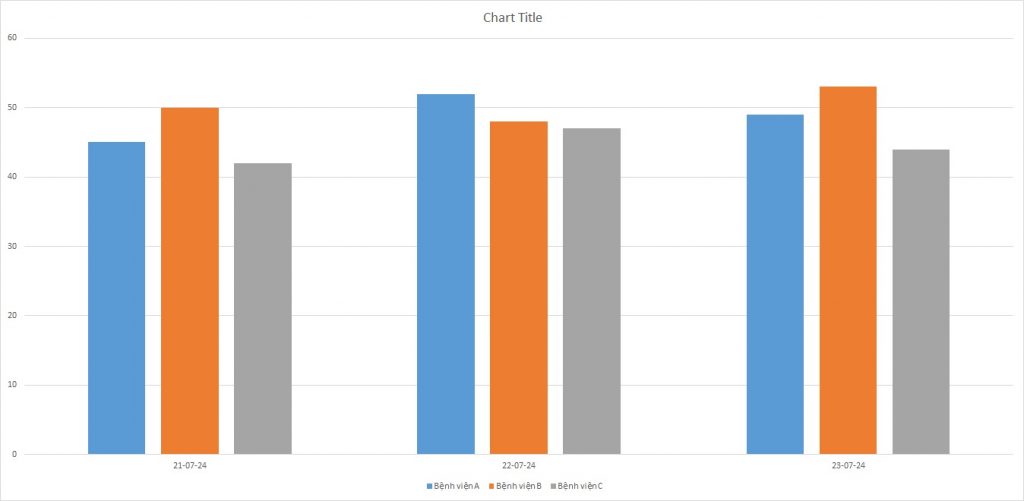
IELTS Writing Task 1 yêu cầu thí sinh mô tả số lượng bệnh nhân nhập viện trong ba ngày tại ba bệnh viện khác nhau thông qua biểu đồ cột (Bar Chart). Thí sinh cần phân tích dữ liệu cụ thể từ biểu đồ, so sánh số liệu giữa các ngày và các bệnh viện, và rút ra những nhận xét quan trọng để thể hiện khả năng phân tích và mô tả biểu đồ một cách rõ ràng và chính xác.
Đọc bài này Cách làm bài IELTS Writing Task 1 Bar Chart trước khi làm bài.
Bạn cũng có thể đọc lại bài nói về Task 1 tại đây: IELTS Writing Task 1 cần lưu ý những gì?
Đọc thêm về xây dựng lộ trình học IELTS của The Real IELTS.
IELTS Writing Task 1 Bar Chart: Patients Admitted
You should spent about 20 mintutes on this task
IELTS Writing Task 1 requires candidates to describe the number of patients admitted over three days at three different hospitals using a bar chart. Candidates need to analyze specific data from the chart, compare the figures between the days and the hospitals, and draw significant observations to demonstrate their ability to analyze and describe the chart clearly and accurately.
You should write at least 150 words.
| Ngày | Bệnh viện A | Bệnh viện B | Bệnh viện C |
| 21-07-24 | 45 | 50 | 42 |
| 22-07-24 | 52 | 48 | 47 |
| 23-07-24 | 49 | 53 | 44 |


Bài mẫu 1
Overview
The table provides data on the number of patients admitted to three hospitals—Hospital A, Hospital B, and Hospital C—over three days from July 21, 2024, to July 23, 2024. This summary examines the fluctuations in patient admissions across these hospitals during this period, highlighting notable trends and comparisons.
Body 1
On July 21, 2024, the patient admissions were relatively balanced across the three hospitals, with Hospital A admitting 45 patients, Hospital B admitting 50, and Hospital C admitting 42. Hospital B had the highest number of admissions, while Hospital C had the lowest. This day marked the start of a period that would see varying admission rates across the hospitals.
On the second day, July 22, 2024, there was a notable increase in the number of patients admitted to Hospital A and Hospital C, while Hospital B saw a slight decrease. Specifically, Hospital A admitted 52 patients, showing a rise of 7 patients from the previous day. Hospital C also experienced an increase, with 47 admissions compared to 42 on the previous day. In contrast, Hospital B admitted 48 patients, which is a decrease of 2 from the previous day.
Body 2
July 23, 2024, revealed another shift in patient admissions. Hospital A saw a slight decrease in admissions, going from 52 to 49 patients. Conversely, Hospital B experienced a rise, admitting 53 patients, the highest number for that hospital over the three days. Hospital C’s admissions slightly decreased to 44 patients.
In summary, over the three days, Hospital B had the most variable admissions, peaking on July 23. Hospital A saw a moderate increase on July 22 before a small decrease on July 23. Hospital C had a steady but slight increase on July 22, followed by a minor decline on July 23. These variations highlight the dynamic nature of hospital admissions and the differing capacities and demands on each hospital.
Bài mẫu 2
Overview
The table provided shows the number of patients admitted to three hospitals – Hospital A, Hospital B, and Hospital C – over three days, from July 21, 2024, to July 23, 2024. This data helps in understanding the daily patient intake at each hospital and comparing the patient loads among these hospitals.
Body 1
On July 21, 2024, Hospital B had the highest number of patient admissions with 50, followed by Hospital A with 45, and Hospital C with 42. This indicates that Hospital B was the busiest on this day, managing a higher patient load compared to the other two hospitals.
On the next day, July 22, 2024, Hospital A saw a significant increase in admissions, reaching 52 patients. Hospital B’s admissions slightly decreased to 48 patients, while Hospital C experienced an increase, admitting 47 patients. Hospital A had the highest number of admissions on this day, suggesting a possible shift in patient distribution.
Body 2
On July 23, 2024, Hospital B again recorded the highest number of admissions with 53 patients, followed by Hospital A with 49 patients. Hospital C had 44 admissions, showing a slight decrease compared to the previous day. This day marked the highest patient intake for Hospital B over the three days, indicating a consistent high patient load.
Overall, the data shows fluctuating patient admissions across the three hospitals, with Hospital B generally handling more patients except on July 22 when Hospital A took the lead. This variation could be due to several factors such as hospital capacity, available facilities, or seasonal health trends.


