IELTS Writing Task 1 yêu cầu mô tả biểu đồ Bar Chart về tần suất sử dụng phương tiện công cộng hàng tháng trong năm 2021 của bốn thành phố khác nhau. Bạn cần phân tích và so sánh dữ liệu, nhấn mạnh các xu hướng chính và sự khác biệt giữa các thành phố, cũng như đưa ra nhận xét tổng quát.
Đọc bài này Cách làm bài IELTS Writing Task 1 Bar Chart trước khi làm bài.
Bạn cũng có thể đọc lại bài nói về Task 1 tại đây: IELTS Writing Task 1 cần lưu ý những gì?
IELTS Writing Task 1 Bar Chart: Public Transportation
You should spent about 20 mintutes on this task
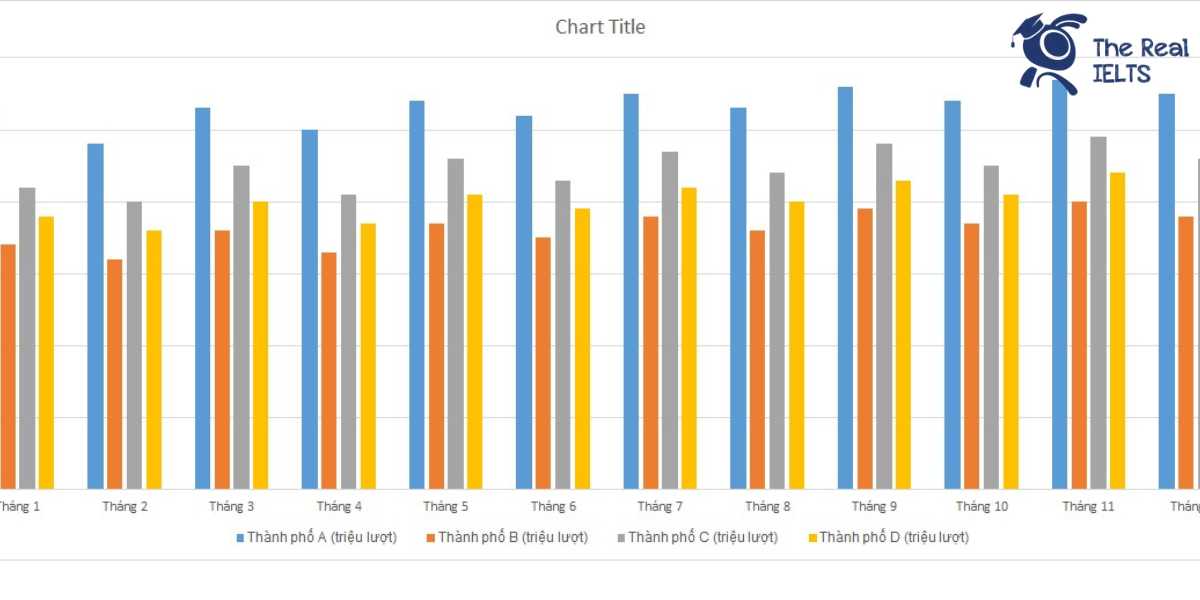
IELTS Writing Task 1 requires describing a Bar Chart showing the monthly frequency of public transportation usage in 2021 for four different cities. You need to analyze and compare the data, highlight the main trends and differences between the cities, and provide an overall comment.
You should write at least 150 words.
| Tháng | Thành phố A (triệu lượt) | Thành phố B (triệu lượt) | Thành phố C (triệu lượt) | Thành phố D (triệu lượt) |
| Tháng 1 | 5.1 | 3.4 | 4.2 | 3.8 |
| Tháng 2 | 4.8 | 3.2 | 4 | 3.6 |
| Tháng 3 | 5.3 | 3.6 | 4.5 | 4 |
| Tháng 4 | 5 | 3.3 | 4.1 | 3.7 |
| Tháng 5 | 5.4 | 3.7 | 4.6 | 4.1 |
| Tháng 6 | 5.2 | 3.5 | 4.3 | 3.9 |
| Tháng 7 | 5.5 | 3.8 | 4.7 | 4.2 |
| Tháng 8 | 5.3 | 3.6 | 4.4 | 4 |
| Tháng 9 | 5.6 | 3.9 | 4.8 | 4.3 |
| Tháng 10 | 5.4 | 3.7 | 4.5 | 4.1 |
| Tháng 11 | 5.7 | 4 | 4.9 | 4.4 |
| Tháng 12 | 5.5 | 3.8 | 4.6 | 4.2 |

Bài mẫu 1
Introduction:
The table presents the monthly usage of public transportation in four cities (A, B, C, and D) during the year 2021. The data is given in millions of rides per month.
Overview:
Overall, City A consistently had the highest usage of public transportation throughout the year, while City B had the lowest. Cities C and D showed moderate and relatively stable usage, with City C generally having slightly higher numbers than City D.
Body 1:
In January, City A recorded 5.1 million rides, which then saw a slight decline in February to 4.8 million. The numbers fluctuated over the year, peaking in November at 5.7 million rides. City B started with 3.4 million rides in January, dipped to 3.2 million in February, and gradually increased, reaching 4.0 million in November, the highest for this city. City C had 4.2 million rides in January, which dropped to 4.0 million in February, and after some fluctuations, peaked at 4.9 million in November.
Body 2:
City D began with 3.8 million rides in January, decreased to 3.6 million in February, and followed a fluctuating pattern throughout the year, peaking at 4.4 million rides in November. The trend for all cities shows a general increase in public transportation usage towards the end of the year, particularly in November, where each city reached its highest monthly ridership. City A’s dominance in public transportation usage is clear, maintaining the highest numbers consistently every month.
Bài mẫu 2
Introduction
The table provides data on the monthly usage frequency of public transportation in four cities—City A, City B, City C, and City D—throughout the year 2021, measured in millions of rides.
Overview
Overall, City A consistently had the highest usage of public transportation each month, while City B had the lowest. City C and City D displayed moderate and similar usage patterns, with City C slightly outperforming City D in most months.
Body 1
In January, City A started with 5.1 million rides, gradually fluctuating but maintaining the highest usage, peaking at 5.7 million rides in November. City B had the lowest figures, beginning at 3.4 million in January, with minor variations, and reaching a maximum of 4.0 million rides in November. City C and City D showed more stable patterns, with City C starting at 4.2 million and ending at 4.9 million, while City D began with 3.8 million and closed the year at 4.4 million rides.
Body 2
The data shows seasonal trends with slight increases during the mid and later parts of the year for all cities. For instance, City A’s usage peaked in the fall, while City B’s highest point was also in November. City C had its highest ridership in November at 4.9 million, whereas City D followed a similar pattern, with November also being its peak month at 4.4 million rides. Despite some fluctuations, all cities demonstrated a relatively stable increase in public transportation usage towards the end of the year.