IELTS Writing Task 1 yêu cầu bạn mô tả biểu đồ Bar Chart về chi phí thuê nhà trong 3 tháng của ba gia đình. Biểu đồ này minh họa sự thay đổi chi phí thuê nhà của các gia đình A, B và C qua ba tháng khác nhau. Nhiệm vụ của bạn là so sánh và phân tích sự khác biệt về chi phí giữa các gia đình, nhấn mạnh các xu hướng nổi bật và đưa ra kết luận phù hợp dựa trên số liệu đã cho.
Đọc bài này Cách làm bài IELTS Writing Task 1 Bar Chart trước khi làm bài.
Bạn cũng có thể đọc lại bài nói về Task 1 tại đây: IELTS Writing Task 1 cần lưu ý những gì?
Đọc thêm về xây dựng lộ trình học IELTS của The Real IELTS.
IELTS Writing Task 1 Bar Chart: Rental Costs
You should spent about 20 mintutes on this task
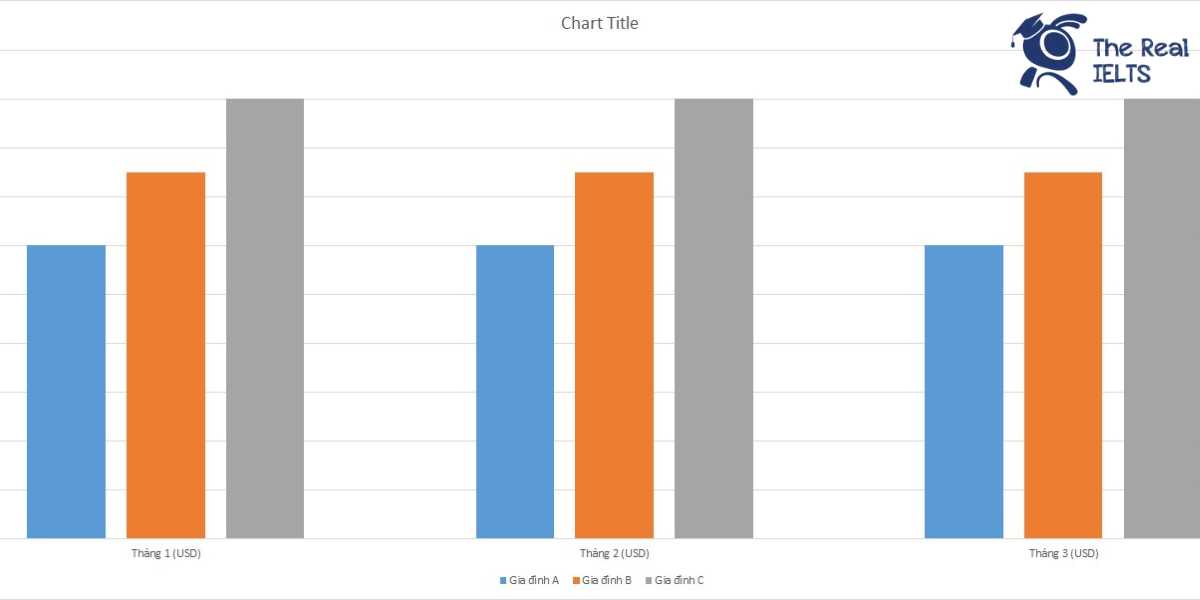
IELTS Writing Task 1 requires you to describe a bar chart illustrating the rental costs over three months for three families. This chart shows the changes in rental costs for families A, B, and C across different months. Your task is to compare and analyze the differences in costs among the families, highlight significant trends, and draw appropriate conclusions based on the provided data.
You should write at least 150 words.
| Gia đình | Tháng 1 (USD) | Tháng 2 (USD) | Tháng 3 (USD) |
| Gia đình A | 1200 | 1200 | 1200 |
| Gia đình B | 1500 | 1500 | 1500 |
| Gia đình C | 1800 | 1800 | 1800 |

Bài mẫu 1
Overview
This article examines the rental costs of three families over a three-month period. The data provided is hypothetical and showcases the monthly expenses for Family A, Family B, and Family C. By analyzing these figures, we can identify patterns and make inferences about the financial implications for each family.
Body 1: Monthly Rent Analysis
Family A consistently pays $1200 per month for their rent. Over three months, their total expenditure on rent amounts to $3600. Family B, on the other hand, pays $1500 monthly, bringing their three-month total to $4500. Family C incurs the highest monthly rent, at $1800, leading to a total of $5400 over the same period. The consistent monthly rent for each family indicates stable housing costs without any significant fluctuations.
Body 2: Comparative Insights
Comparing the three families, Family C bears the highest rental burden, paying $600 more monthly than Family A and $300 more than Family B. Over three months, Family C spends $1800 more than Family A and $900 more than Family B. This disparity highlights the varying financial pressures each family faces. It is evident that Family A has the most affordable rent, which could imply a smaller or less luxurious living space compared to the other families. Conversely, Family C’s higher rent suggests a larger or more upscale residence. Understanding these differences helps in assessing the economic stability and housing choices of each family.
Bài mẫu 2
Overview:
Overall, the table demonstrates that the rental costs for all three families remained constant over the three months. Family C had the highest rental expenses, followed by Family B and Family A, respectively.
Body 1:
In January, Family A paid $1200 in rent, which was the lowest amount among the three families. Family B had a higher rent of $1500, and Family C had the highest rental cost at $1800. These figures indicate a clear hierarchy in rental expenses, with Family C paying the most and Family A the least.
Body 2:
This trend continued unchanged in the subsequent months. Both in February and March, Family A’s rental cost remained at $1200, Family B’s at $1500, and Family C’s at $1800. The stability in these expenses over the three-month period suggests that all three families had fixed rental agreements during this time.
In summary, the table reflects the stability in monthly rental costs for three families, with Family C consistently incurring the highest rent and Family A the lowest throughout the three months.