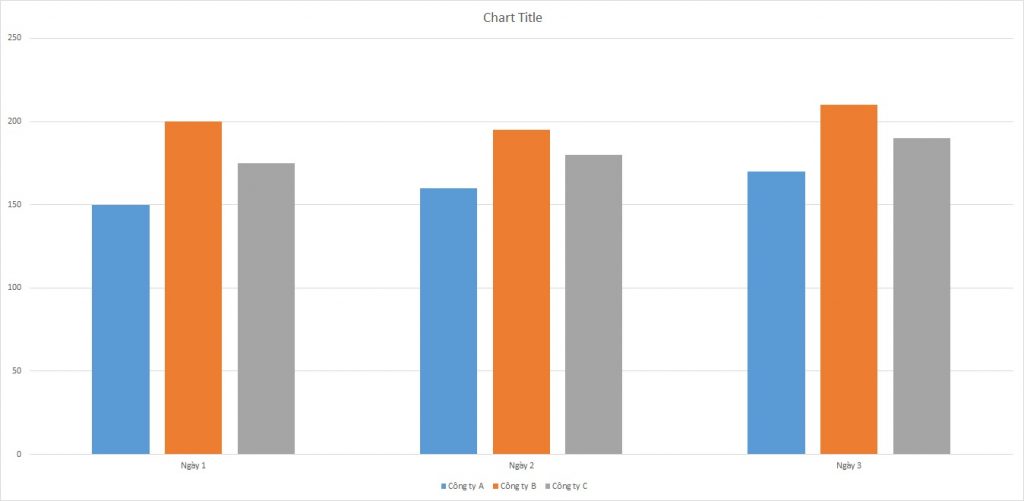
IELTS Writing Task 1 Bar Chart: Service Calls. Biểu đồ cột (Bar Chart) mô tả số lượng cuộc gọi chăm sóc khách hàng của ba công ty trong ba ngày. Biểu đồ cung cấp cái nhìn tổng quan về sự biến động trong dịch vụ khách hàng của từng công ty, giúp so sánh hiệu suất giữa các công ty trong khoảng thời gian này.
Đọc bài này Cách làm bài IELTS Writing Task 1 Bar Chart trước khi làm bài.
Bạn cũng có thể đọc lại bài nói về Task 1 tại đây: IELTS Writing Task 1 cần lưu ý những gì?
Đọc thêm về xây dựng lộ trình học IELTS của The Real IELTS.
IELTS Writing Task 1 Bar Chart: Service Calls
You should spent about 20 mintutes on this task
The bar chart illustrates the number of customer service calls made by three companies over three days. The chart provides an overview of the fluctuations in customer service across each company, allowing for a comparison of performance between the companies during this period.
You should write at least 150 words.
| Ngày | Công ty A | Công ty B | Công ty C |
| Ngày 1 | 150 | 200 | 175 |
| Ngày 2 | 160 | 195 | 180 |
| Ngày 3 | 170 | 210 | 190 |


Bài mẫu 1
Overview
The table provides a summary of the number of customer service calls handled by three companies—Company A, Company B, and Company C—over a period of three days. This statistical data is crucial for understanding the customer service demand and the efficiency of each company’s response capability.
Body 1
Company A experienced a steady increase in the number of calls over the three days. On Day 1, they handled 150 calls. This number rose to 160 on Day 2, and further increased to 170 on Day 3. The consistent rise indicates either an increasing customer base or an accumulation of unresolved issues prompting follow-up calls. It is essential for Company A to analyze this trend to ensure they have the necessary resources to maintain their service levels.
Body 2
Company B received the highest number of calls among the three companies each day. On Day 1, they managed 200 calls, followed by a slight drop to 195 on Day 2, and then a significant increase to 210 on Day 3. The fluctuations suggest variability in the customer service demand. Company B should investigate the causes of these fluctuations to better predict and prepare for high-volume days. Their capacity to handle such a large volume of calls consistently positions them as a potentially leading customer service provider.
Company C also saw an upward trend in call volume. Starting with 175 calls on Day 1, they received 180 calls on Day 2, and 190 on Day 3. Although the increase is not as steep as that of Company A, it still indicates a growing need for customer support. Company C must ensure that their customer service team scales appropriately to handle this growth without compromising on the quality of service.
Conclusion
Overall, the data highlights the importance of monitoring call volumes and understanding the factors driving changes in customer service demand. Each company has shown different trends in call volumes, which suggests that they need to tailor their strategies to address their unique challenges and opportunities in customer service. By doing so, they can enhance their customer satisfaction and operational efficiency.
Bài mẫu 2
Overview
This report analyzes the customer service call volumes for three companies, labeled A, B, and C, over a span of three days. The data illustrates the number of calls each company received daily, allowing for a comparative analysis of their customer service demand.
Body 1
On the first day, Company B received the highest number of customer service calls, totaling 200. Company C followed with 175 calls, while Company A had the least with 150 calls. This initial distribution indicates that Company B experienced a higher customer interaction level compared to the other two companies.
Body 2
As the days progressed, there was a noticeable increase in call volumes for all three companies. On the second day, Company A’s call volume increased to 160, Company B’s call volume slightly decreased to 195, and Company C’s call volume rose to 180. By the third day, Company A’s calls had grown to 170, Company B experienced a significant increase to 210, and Company C saw a rise to 190 calls. This trend suggests an overall growth in customer service needs, with Company B consistently leading in call volumes, highlighting their possibly larger customer base or more active customer engagement.


