IELTS Writing Task 1 yêu cầu mô tả biểu đồ cột (Bar Chart) về số lượng bài đăng trên mạng xã hội trong 3 tháng của ba nhà văn. Người viết phải so sánh và phân tích xu hướng, sự khác biệt, và điểm nổi bật giữa các nhà văn trong giai đoạn này, sử dụng số liệu cụ thể từ biểu đồ.
Đọc bài này Cách làm bài IELTS Writing Task 1 Bar Chart trước khi làm bài.
Bạn cũng có thể đọc lại bài nói về Task 1 tại đây: IELTS Writing Task 1 cần lưu ý những gì?
Đọc thêm về xây dựng lộ trình học IELTS của The Real IELTS.
IELTS Writing Task 1 Bar Chart: Social Media
You should spent about 20 mintutes on this task
IELTS Writing Task 1 requires describing a bar chart about the number of social media posts over 3 months by three writers. The writer must compare and analyze trends, differences, and highlights among the writers during this period, using specific data from the chart.
You should write at least 150 words
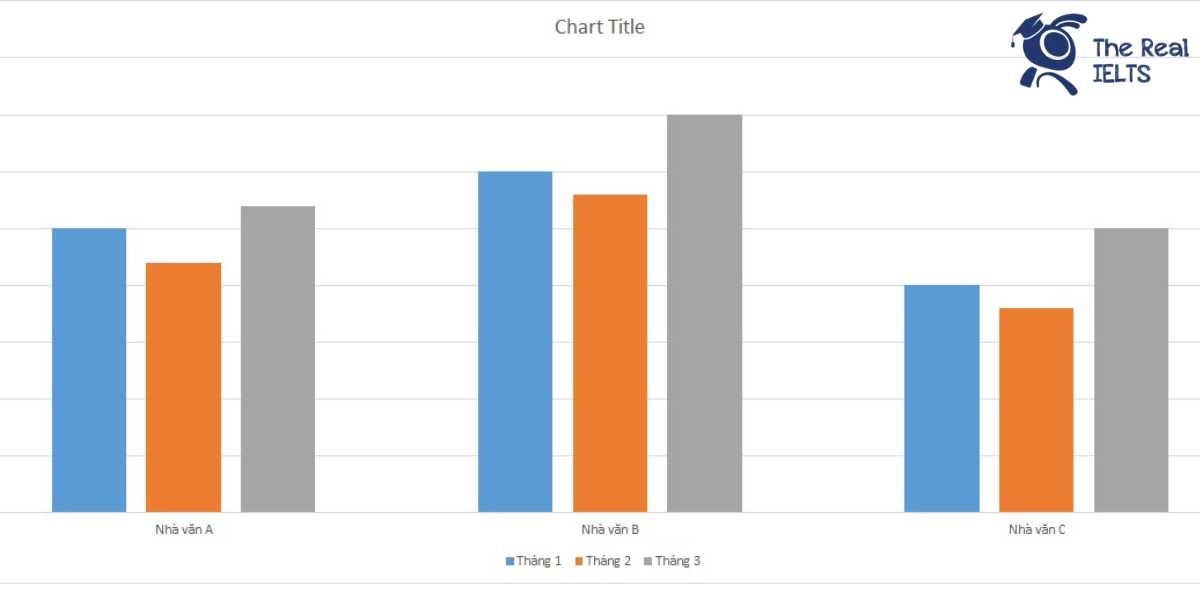
| Tháng | Nhà văn A | Nhà văn B | Nhà văn C |
| Tháng 1 | 25 | 30 | 20 |
| Tháng 2 | 22 | 28 | 18 |
| Tháng 3 | 27 | 35 | 25 |

Bài mẫu 1
Introduction
The table illustrates the number of social media posts made by three writers (A, B, and C) over three months (January, February, and March).
Overview
Overall, Writer B consistently produced the highest number of posts each month, while Writer C had the lowest figures. All three writers exhibited fluctuations in their posting activity, with a general increase in March.
Body 1
In January, Writer A posted 25 times, Writer B made 30 posts, and Writer C had 20 posts. In February, the number of posts decreased slightly for all three writers. Writer A’s posts dropped to 22, Writer B’s to 28, and Writer C’s to 18. This indicates a minor dip in their activity levels during the second month.
Body 2
In March, there was a notable increase in the number of posts from all writers. Writer A’s posts rose to 27, showing a recovery and slight increase from January. Writer B’s posts increased significantly to 35, marking their highest monthly total. Writer C also saw an increase, reaching 25 posts, which was the highest number of posts they made during the three months. This upward trend in March suggests a boost in their social media activity as the quarter progressed.
Bài mẫu 2
Introduction
The table provides information about the number of social media posts made by three writers—Writer A, Writer B, and Writer C—over a three-month period from January to March.
Overview
Overall, it can be observed that Writer B consistently made the highest number of posts each month, while Writer C had the fewest posts in most of the months. There is a general trend of increasing activity for all three writers towards the end of the period.
Body 1
In January, Writer B was the most active with 30 posts, followed by Writer A with 25 posts, and Writer C with 20 posts. The number of posts decreased slightly in February for all writers, with Writer B dropping to 28 posts, Writer A to 22 posts, and Writer C to 18 posts.
Body 2
In March, there was a notable increase in the number of posts for all writers. Writer B’s posts peaked at 35, making it the highest for the entire period. Writer A also showed a significant rise, reaching 27 posts, while Writer C’s activity increased to 25 posts, the highest number for this writer during the three months.