IELTS Writing Task 1 yêu cầu thí sinh mô tả biểu đồ cột về lượng tiêu thụ nước ngọt trong ba ngày của ba cụm cư dân khác nhau. Biểu đồ minh họa sự khác biệt về mức độ tiêu thụ giữa các cụm cư dân này theo từng ngày, giúp thí sinh phân tích và so sánh các số liệu. Việc nắm vững cấu trúc và ngôn ngữ mô tả biểu đồ là cần thiết để đạt điểm cao trong phần thi này.
Đọc bài này Cách làm bài IELTS Writing Task 1 Bar Chart trước khi làm bài.
Bạn cũng có thể đọc lại bài nói về Task 1 tại đây: IELTS Writing Task 1 cần lưu ý những gì?
Đọc thêm về xây dựng lộ trình học IELTS của The Real IELTS.
IELTS Writing Task 1 Bar Chart: Soft Drinks
You should spent about 20 mintutes on this task
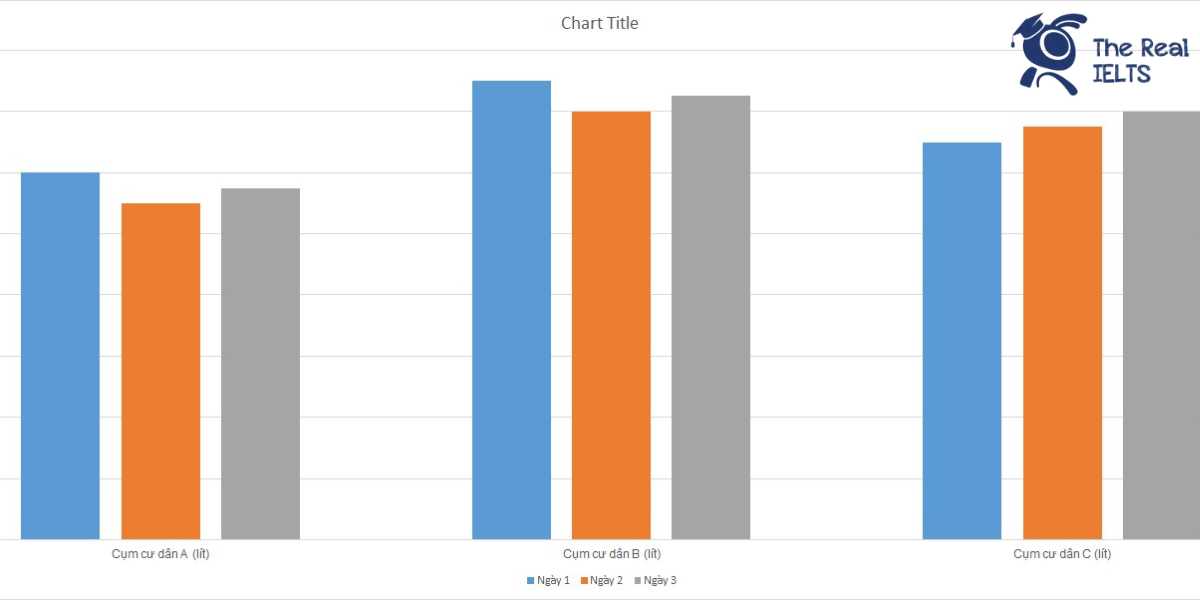
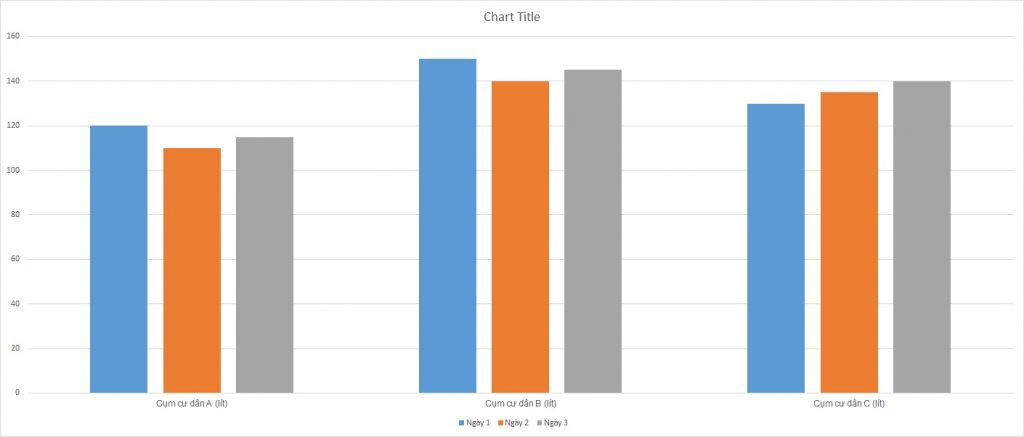
IELTS Writing Task 1 requires candidates to describe a bar chart showing the consumption of soft drinks over three days by three different clusters of residents. The chart illustrates the differences in consumption levels among these clusters on each day, helping candidates analyze and compare the data. Mastering the structure and language of chart descriptions is essential to achieve a high score in this task.
You should write at least 150 words.
| Ngày | Cụm cư dân A (lít) | Cụm cư dân B (lít) | Cụm cư dân C (lít) |
| Ngày 1 | 120 | 150 | 130 |
| Ngày 2 | 110 | 140 | 135 |
| Ngày 3 | 115 | 145 | 140 |
Bài mẫu 1
Overview
The following report presents an analysis of the soft drink consumption over three days across three residential clusters: Cluster A, Cluster B, and Cluster C. The data, though hypothetical, provides insight into daily variations and overall consumption patterns within these clusters.
Body 1
On Day 1, Cluster A consumed 120 liters of soft drinks, Cluster B consumed 150 liters, and Cluster C consumed 130 liters. This initial day shows that Cluster B had the highest consumption, leading by a significant margin of 30 liters compared to Cluster A, and 20 liters compared to Cluster C. This suggests that Cluster B residents had a notably higher demand for soft drinks on the first day.
Body 2
Day 2 saw a slight decrease in consumption for all clusters. Cluster A consumed 110 liters, Cluster B 140 liters, and Cluster C 135 liters. The trend of Cluster B having the highest consumption continued, though the gap between Cluster B and the other clusters narrowed. On the final day, Cluster A consumed 115 liters, Cluster B 145 liters, and Cluster C 140 liters. This day showed a slight recovery in consumption, with all clusters except for Cluster A increasing their intake compared to Day 2. Cluster B remained the leading consumer, consistently showing the highest consumption across all three days.
In summary, Cluster B had the highest soft drink consumption each day, followed by Cluster C, and then Cluster A. The overall pattern suggests a steady preference for soft drinks in Cluster B, with minor fluctuations in consumption across the three days.
Bài mẫu 2
Overview
Overall, Cluster B consistently consumed the most soft drinks over the three days, while Cluster A had the lowest consumption. The consumption pattern for all clusters showed minor fluctuations over the observed period.
Body 1
On the first day, Cluster B had the highest consumption with 150 liters, followed by Cluster C with 130 liters, and Cluster A with 120 liters. On the second day, all clusters showed a decrease in consumption except for Cluster C. Cluster B again led with 140 liters, while Cluster A saw the most significant drop to 110 liters. Cluster C, however, experienced a slight increase, consuming 135 liters.
Body 2
On the third day, there was a slight increase in consumption for Cluster A and Cluster B, whereas Cluster C continued its upward trend. Cluster B’s consumption rose to 145 liters, maintaining its leading position. Cluster A’s consumption increased to 115 liters, and Cluster C recorded the highest increase over the period, reaching 140 liters. Despite these fluctuations, Cluster B remained the highest consumer overall, while Cluster A consistently consumed the least.