IELTS Writing Task 1 yêu cầu phân tích biểu đồ bar chart về điểm trung bình môn học của học sinh trong năm 2021 tại bốn trường tiểu học. Người viết cần so sánh các số liệu, mô tả sự khác biệt và xu hướng nổi bật giữa các trường, đưa ra cái nhìn tổng quan và chi tiết về thành tích học tập.
Đọc bài này Cách làm bài IELTS Writing Task 1 Bar Chart trước khi làm bài.
Bạn cũng có thể đọc lại bài nói về Task 1 tại đây: IELTS Writing Task 1 cần lưu ý những gì?
IELTS Writing Task 1 Bar Chart: Students’s Scores
You should spent about 20 mintutes on this task
IELTS Writing Task 1 requires analyzing a bar chart showing the average subject scores of students in 2021 at four primary schools. The writer needs to compare the data, describe the differences and prominent trends among the schools, and provide an overview and detailed insight into academic performance.
You should write at least 150 words.
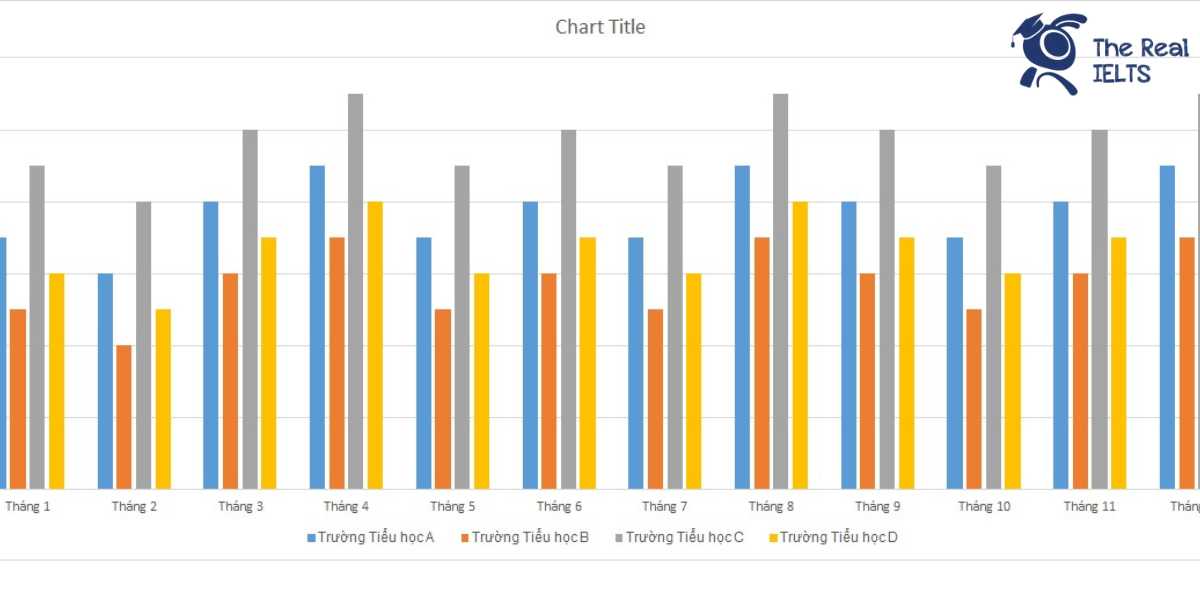
| Tháng | Trường Tiểu học A | Trường Tiểu học B | Trường Tiểu học C | Trường Tiểu học D |
| Tháng 1 | 8.5 | 8.3 | 8.7 | 8.4 |
| Tháng 2 | 8.4 | 8.2 | 8.6 | 8.3 |
| Tháng 3 | 8.6 | 8.4 | 8.8 | 8.5 |
| Tháng 4 | 8.7 | 8.5 | 8.9 | 8.6 |
| Tháng 5 | 8.5 | 8.3 | 8.7 | 8.4 |
| Tháng 6 | 8.6 | 8.4 | 8.8 | 8.5 |
| Tháng 7 | 8.5 | 8.3 | 8.7 | 8.4 |
| Tháng 8 | 8.7 | 8.5 | 8.9 | 8.6 |
| Tháng 9 | 8.6 | 8.4 | 8.8 | 8.5 |
| Tháng 10 | 8.5 | 8.3 | 8.7 | 8.4 |
| Tháng 11 | 8.6 | 8.4 | 8.8 | 8.5 |
| Tháng 12 | 8.7 | 8.5 | 8.9 | 8.6 |

Bài mẫu
The table illustrates the average grades of students from four primary schools (School A, School B, School C, and School D) in 2021.
Overall, all schools demonstrated consistent performance throughout the year with minimal fluctuations in their average grades. Among the schools, School C consistently achieved the highest average scores, while School B had the lowest averages each month.
In the first half of the year, School A’s average grades ranged from 8.4 to 8.7, peaking in April. Similarly, School B’s grades varied between 8.2 in February and 8.5 in April. School C showed a steady pattern with averages consistently between 8.6 and 8.9, reaching its highest points in April and August. School D’s scores were fairly stable, maintaining averages between 8.3 and 8.6.
In the latter half of the year, the trends remained similar. School A and School D continued to show stable performance with averages from 8.5 to 8.7 and 8.4 to 8.6 respectively. School B’s grades fluctuated slightly but remained within the 8.3 to 8.5 range. Meanwhile, School C maintained its leading position with grades consistently at 8.7 to 8.9.
In conclusion, while all four schools performed well throughout the year, School C led with the highest average grades, and School B, although performing well, had the lowest averages among the four schools.