IELTS Writing Task 1 yêu cầu thí sinh mô tả biểu đồ cột (Bar Chart) về chi phí dịch vụ viễn thông của ba hãng khác nhau trong ba tháng. Thí sinh cần phân tích sự biến động chi phí, so sánh sự khác biệt giữa các hãng và xu hướng trong khoảng thời gian này. Bài viết nên bao gồm các thông tin chính xác, cụ thể và sử dụng ngôn ngữ rõ ràng, súc tích để đạt điểm cao.
Đọc bài này Cách làm bài IELTS Writing Task 1 Bar Chart trước khi làm bài.
Bạn cũng có thể đọc lại bài nói về Task 1 tại đây: IELTS Writing Task 1 cần lưu ý những gì?
Đọc thêm về xây dựng lộ trình học IELTS của The Real IELTS.
IELTS Writing Task 1 Bar Chart: Telecommunications
You should spent about 20 mintutes on this task
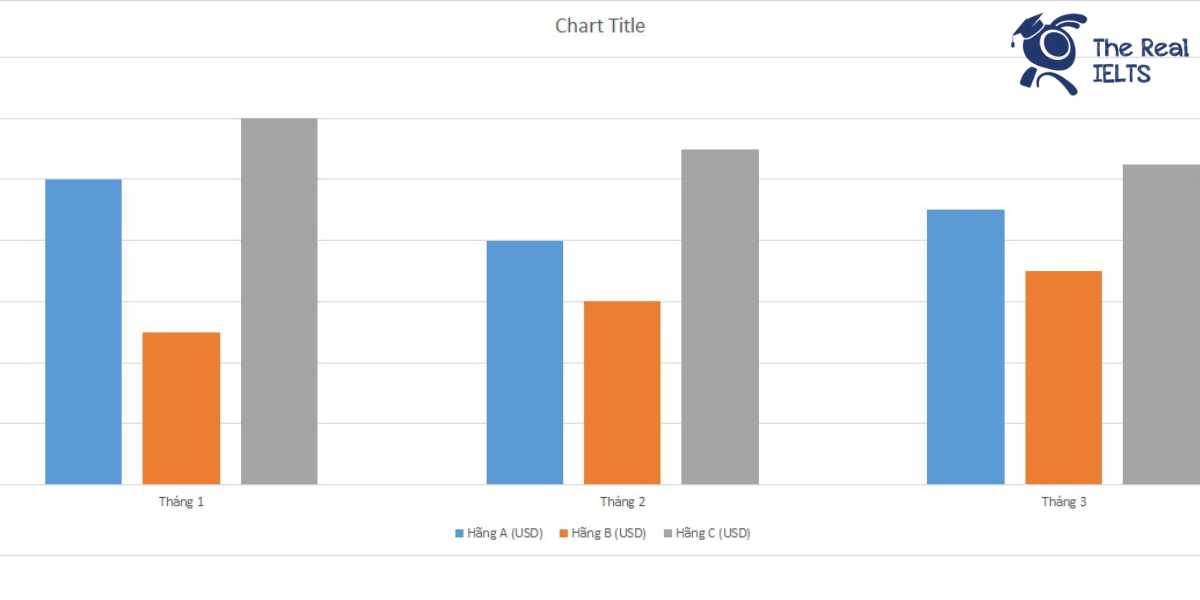
IELTS Writing Task 1 requires candidates to describe a bar chart depicting the telecommunications service costs of three different companies over three months. Candidates need to analyze the fluctuations in costs, compare the differences between the companies, and identify trends over this period. The essay should include accurate, specific information and use clear, concise language to achieve a high score.
You should write at least 150 words.
| Tháng | Hãng A (USD) | Hãng B (USD) | Hãng C (USD) |
| Tháng 1 | 50,000 | 45,000 | 52,000 |
| Tháng 2 | 48,000 | 46,000 | 51,000 |
| Tháng 3 | 49,000 | 47,000 | 50,500 |

Bài mẫu 1
Overview
The table provides an analysis of telecommunication service costs for three different companies—Company A, Company B, and Company C—over three months. The data, represented in USD, highlights the monthly expenses incurred by each company from January to March. This overview offers insights into the cost trends and allows for a comparative analysis of each company’s expenditure over the specified period.
Body 1: Monthly Cost Analysis
In January, Company A had the highest expenditure at $50,000, followed closely by Company C at $52,000, and Company B at $45,000. This initial month shows a significant variance in costs among the three companies, with Company B being the most economical choice. Moving into February, the costs for Company A decreased slightly to $48,000, while Company B experienced a minor increase to $46,000. Company C also saw a reduction, bringing its costs down to $51,000. Despite these changes, Company B continued to maintain the lowest expenditure among the three.
Body 2: Overall Trends and Comparisons
March saw a further convergence in costs, with Company A’s expenses rising to $49,000 and Company B’s to $47,000. Company C, on the other hand, reduced its costs to $50,500. This month marked the smallest difference in costs between the three companies, indicating a trend towards cost optimization across the board. Over the three months, Company B consistently maintained the lowest costs, making it the most cost-effective provider. Company A’s costs showed a slight downward trend, while Company C demonstrated the most fluctuation. Overall, the data suggests a competitive landscape where each company is striving to manage and reduce their telecommunications expenses effectively.
Bài mẫu 2
Overview
The table presents the monthly telecommunications service costs for three different companies (Company A, Company B, and Company C) over a three-month period. The data highlights the variations in costs among the companies from January to March.
Body 1
In January, Company A had the highest service cost at $50,000, followed closely by Company C at $52,000, and Company B at $45,000. This initial month shows a noticeable disparity among the companies, with Company C leading in expenditures and Company B having the lowest cost.
In February, the costs for all companies showed slight changes. Company A’s expenses decreased to $48,000, while Company B saw a small increase to $46,000. Company C experienced a slight reduction in cost to $51,000. Despite these changes, Company C remained the highest spender, with Company B still having the lowest cost among the three.
Body 2
March saw further adjustments in telecommunications costs. Company A’s costs increased marginally to $49,000. Company B continued its upward trend with costs rising to $47,000. Meanwhile, Company C’s expenses dropped to $50,500. Although Company C maintained the highest costs overall, the gap between the companies’ expenses narrowed over the three months, showing a trend towards more similar expenditure levels.
In summary, over the three months, Company C consistently had the highest telecommunications service costs, while Company B had the lowest. Company A’s costs fluctuated slightly but remained intermediate compared to the other two companies. The data indicates a gradual convergence in service costs among the three companies by the end of the period.