IELTS Writing Task 1 yêu cầu thí sinh mô tả biểu đồ Bar Chart về tỷ lệ tai nạn giao thông trong ba tháng của ba thành phố khác nhau. Thí sinh cần phân tích số liệu, so sánh các xu hướng, và đưa ra nhận định về sự khác biệt hoặc tương đồng giữa các thành phố trong giai đoạn đó.
Đọc bài này Cách làm bài IELTS Writing Task 1 Bar Chart trước khi làm bài.
Bạn cũng có thể đọc lại bài nói về Task 1 tại đây: IELTS Writing Task 1 cần lưu ý những gì?
IELTS Writing Task 1 Bar Chart: Traffic Accident
You should spent about 20 mintutes on this task
IELTS Writing Task 1 requires candidates to describe a Bar Chart depicting the traffic accident rates over three months in three different cities. Candidates need to analyze the data, compare the trends, and provide observations on the differences or similarities between the cities during that period.
You should write at least 150 words.
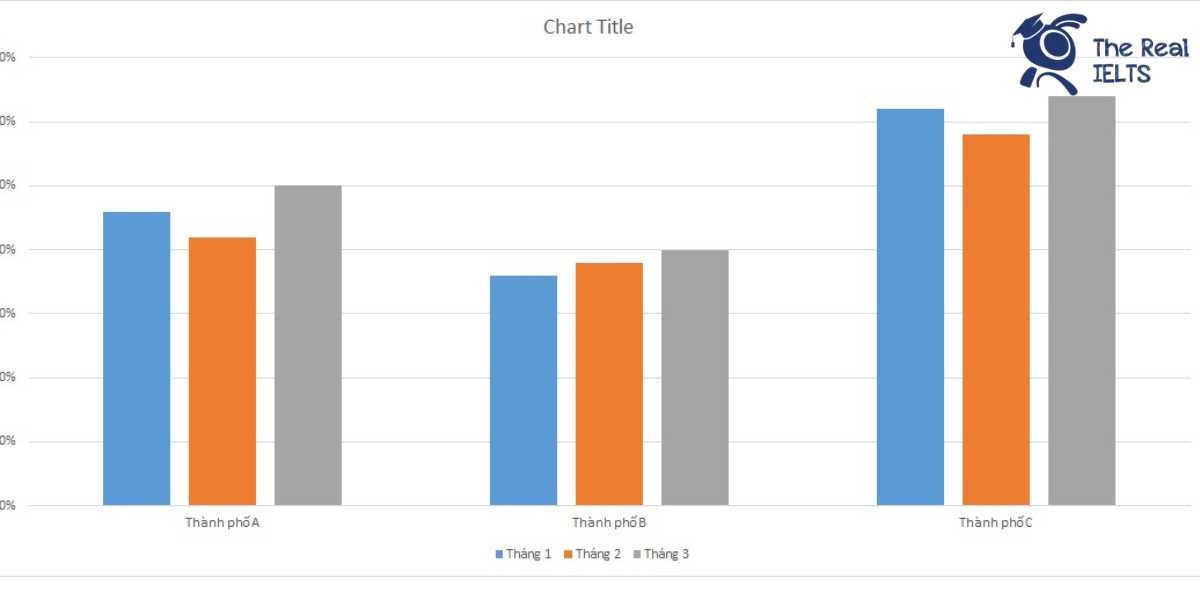
| Thành phố | Tháng 1 | Tháng 2 | Tháng 3 |
| Thành phố A | 2.30% | 2.10% | 2.50% |
| Thành phố B | 1.80% | 1.90% | 2.00% |
| Thành phố C | 3.10% | 2.90% | 3.20% |

Bài mẫu 1
Introduction: The table provides statistical data on the traffic accident rates in three cities, labeled as City A, City B, and City C, over a span of three months: January, February, and March.
Overview: Overall, City C consistently has the highest accident rates across all three months, whereas City B has the lowest. Both City A and City C experience fluctuations in their accident rates, while City B shows a gradual increase over the period.
Body 1: In January, City A has an accident rate of 2.3%, which slightly decreases to 2.1% in February before rising again to 2.5% in March. City B, on the other hand, starts with a lower rate of 1.8% in January, which increases marginally to 1.9% in February and then to 2.0% in March.
Body 2: City C records the highest accident rates among the three cities, beginning with 3.1% in January. This rate sees a minor decline to 2.9% in February but increases again to 3.2% in March, marking the highest rate observed in the table. This trend indicates that while City B experiences a steady rise, both City A and City C exhibit more variability in their accident rates over the three months.
Bài mẫu 2
Introduction
The table provides information on the percentage of traffic accidents that occurred over three months (January, February, and March) in three different cities: City A, City B, and City C.
Overview
Overall, City C consistently experienced the highest traffic accident rates throughout the three months, while City B had the lowest rates. City A’s accident rates fluctuated but remained between those of City B and City C.
Body 1
In January, City A had a traffic accident rate of 2.3%, which slightly decreased to 2.1% in February before rising to 2.5% in March. City B, on the other hand, saw a gradual increase in its accident rates, starting at 1.8% in January, increasing to 1.9% in February, and reaching 2.0% in March.
Body 2
City C consistently had the highest rates among the three cities. It began with a rate of 3.1% in January, experienced a minor decline to 2.9% in February, and then increased again to 3.2% in March. This city’s rates were noticeably higher than those of City A and City B throughout the observed period.
In summary, while City B showed a steady upward trend, City A’s and City C’s rates varied month by month, with City C maintaining the highest percentages of traffic accidents.
Bài mẫu 3
The table below presents the percentages of traffic accidents in three different cities over three months. The data, although hypothetical, reveals notable patterns and variations in traffic accident rates across the cities and time periods.
Overall, it is evident that City C consistently has the highest traffic accident rates throughout the observed period, while City B maintains the lowest rates. City A, on the other hand, shows a fluctuating trend.
In January, City C recorded the highest accident rate at 3.1%, followed by City A at 2.3%, and City B with the lowest at 1.8%. Moving to February, all cities experienced slight changes. City C’s rate decreased to 2.9%, City A saw a minor drop to 2.1%, and City B’s rate increased slightly to 1.9%.
In March, the accident rates rose again. City C reached its peak at 3.2%, City A increased to 2.5%, and City B also saw a rise, though it remained the lowest among the three cities at 2.0%.
In conclusion, City C consistently has the highest traffic accident rates, whereas City B maintains the lowest rates, with City A showing moderate fluctuations.