IELTS Writing Task 1 yêu cầu thí sinh mô tả biểu đồ thanh (bar chart) minh họa tỷ lệ người dân sử dụng điện thoại thông minh trong 3 năm ở ba quốc gia. Bài viết nên tập trung vào so sánh số liệu giữa các năm và các quốc gia, chỉ ra xu hướng tăng giảm rõ rệt và nhấn mạnh các điểm đáng chú ý nhất trong biểu đồ để cung cấp cái nhìn tổng quan và chi tiết.
Đọc bài này Cách làm bài IELTS Writing Task 1 Bar Chart trước khi làm bài.
Bạn cũng có thể đọc lại bài nói về Task 1 tại đây: IELTS Writing Task 1 cần lưu ý những gì?
Đọc thêm về xây dựng lộ trình học IELTS của The Real IELTS.
IELTS Writing Task 1 Bar Chart: Using Smartphones
You should spent about 20 mintutes on this task
IELTS Writing Task 1 requires candidates to describe a bar chart illustrating the percentage of people using smartphones over three years in three countries. The essay should focus on comparing the data between years and countries, highlighting significant increasing or decreasing trends, and emphasizing the most notable points in the chart to provide a comprehensive and detailed overview.
You should write at least 150 words.
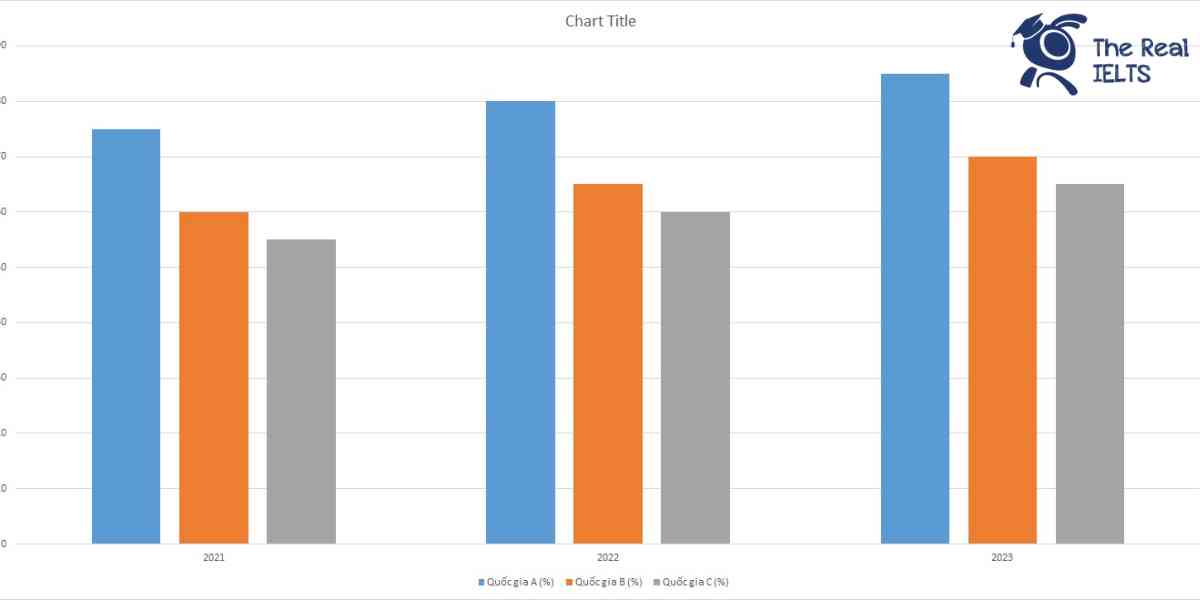
| Năm | Quốc gia A (%) | Quốc gia B (%) | Quốc gia C (%) |
| 2021 | 75 | 60 | 55 |
| 2022 | 80 | 65 | 60 |
| 2023 | 85 | 70 | 65 |

Bài mẫu 1
Overview
The use of smartphones has seen a steady increase over the past three years in three countries: Country A, Country B, and Country C. The data, covering the years 2021 to 2023, highlights the growing penetration of smartphones in these regions, showcasing the technological adoption and connectivity improvements among their populations.
Body 1
In 2021, the percentage of people using smartphones was 75% in Country A, 60% in Country B, and 55% in Country C. This initial data set reveals that Country A was leading in smartphone adoption, with a significant 15% higher usage rate compared to Country B and a 20% higher rate than Country C. These figures suggest that Country A was more technologically advanced or had better access to smartphone technology and infrastructure at the time.
Body 2
The trend continued positively in the following years. By 2022, the smartphone usage rates had increased to 80% in Country A, 65% in Country B, and 60% in Country C. This growth indicates a consistent rise in smartphone adoption, with each country showing a 5% increase from the previous year. By 2023, the usage rates further escalated to 85% in Country A, 70% in Country B, and 65% in Country C. This data not only confirms the ongoing trend of increasing smartphone penetration but also highlights the narrowing gap between these countries in terms of smartphone usage. Country A continues to lead, but the other countries are catching up steadily, reflecting overall improvements in technological access and affordability.
Bài mẫu 2
Overview
The following analysis examines the smartphone usage rates in three countries—Country A, Country B, and Country C—over a period of three years: 2021, 2022, and 2023. The data indicates a consistent increase in smartphone adoption across all three nations, with each showing a positive trend in usage rates during the specified timeframe.
Body 1
In 2021, the initial year of the study, Country A had the highest smartphone usage rate at 75%. This was followed by Country B at 60%, and Country C at 55%. This distribution shows that while all three countries had significant smartphone penetration, Country A was notably ahead in terms of adoption.
Moving to 2022, the smartphone usage rates increased in all three countries. Country A’s rate rose to 80%, maintaining its leading position. Country B saw an increase to 65%, while Country C’s rate went up to 60%. The consistent growth in each country suggests a widespread and increasing dependence on smartphone technology.
Body 2
By 2023, the upward trend continued. Country A reached an impressive 85% in smartphone usage, reflecting a significant adoption rate among its population. Country B followed with 70%, showing steady growth. Country C also demonstrated continued progress, achieving a 65% usage rate.
Overall, the data reveals a clear pattern of increasing smartphone use across these three countries over the three years. Country A consistently led in smartphone penetration, while Countries B and C also experienced substantial growth, albeit at a slightly slower pace. This trend indicates a global move towards greater connectivity and technological integration in daily life.