IELTS Writing Task 1 yêu cầu bạn phân tích biểu đồ thanh (Bar Chart) về tỷ lệ tiêm chủng của trẻ em trong ba khu vực khác nhau trong ba tháng. Biểu đồ cho thấy mức độ tiêm chủng qua các tháng và khu vực, giúp so sánh sự thay đổi và xu hướng trong tỷ lệ tiêm chủng giữa các khu vực.
Đọc bài này Cách làm bài IELTS Writing Task 1 Bar Chart trước khi làm bài.
Bạn cũng có thể đọc lại bài nói về Task 1 tại đây: IELTS Writing Task 1 cần lưu ý những gì?
Đọc thêm về xây dựng lộ trình học IELTS của The Real IELTS.
IELTS Writing Task 1 Bar Chart: Vaccination Rates
You should spent about 20 mintutes on this task
In IELTS Writing Task 1, you are required to analyze a bar chart showing the vaccination rates of children in three different regions over three months. The chart illustrates the vaccination levels across the months and regions, allowing you to compare changes and trends in vaccination rates among the regions.
You should write at least 150 words.
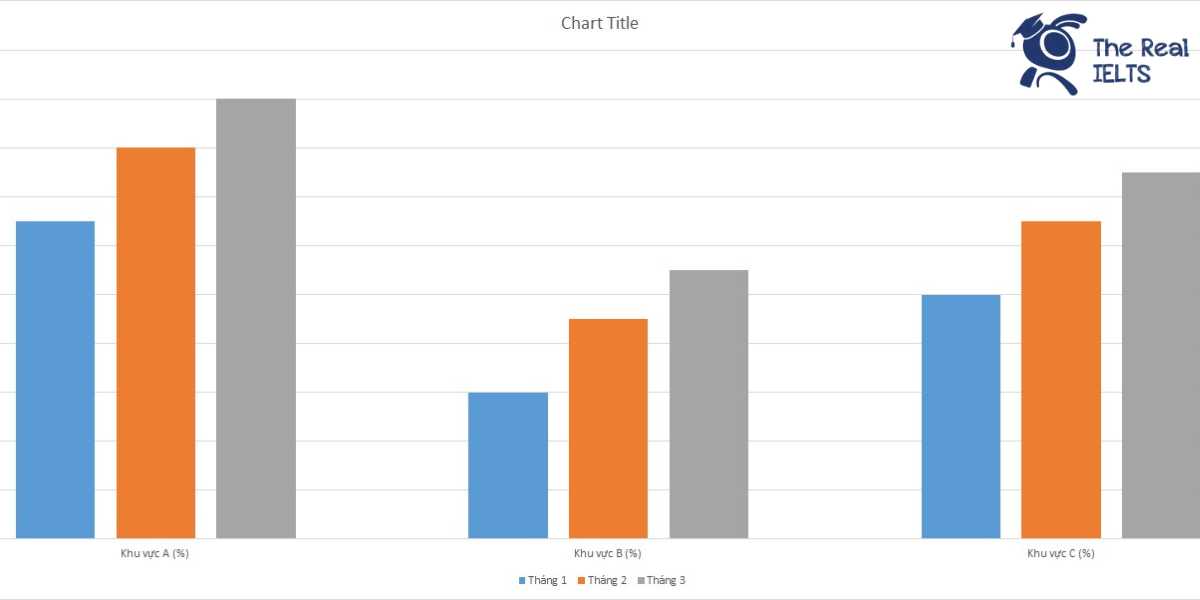
| Tháng | Khu vực A (%) | Khu vực B (%) | Khu vực C (%) |
| Tháng 1 | 85 | 78 | 82 |
| Tháng 2 | 88 | 81 | 85 |
| Tháng 3 | 90 | 83 | 87 |

Bài mẫu 1
Overview
The table below provides a summary of the vaccination rates among children in three different regions over a span of three months. These regions, labeled as Area A, Area B, and Area C, demonstrate varying levels of vaccination coverage, reflecting the efforts and progress made in each area to ensure child health and immunity.
Body 1
In January, the vaccination rates were 85% in Area A, 78% in Area B, and 82% in Area C. This indicates that Area A had the highest initial vaccination rate, while Area B had the lowest. The efforts to vaccinate children in these areas were already significant, with over three-quarters of children in each area receiving vaccinations.
Body 2
By February, all three areas saw an increase in vaccination rates. Area A reached 88%, Area B improved to 81%, and Area C climbed to 85%. This upward trend suggests successful vaccination campaigns and increased public awareness about the importance of vaccinations. The consistent rise in vaccination rates across all areas signifies a positive movement toward better health outcomes for children.
In March, the trend of increasing vaccination rates continued. Area A achieved a 90% vaccination rate, making it the leading area in terms of vaccination coverage. Area B and Area C also showed progress, with rates of 83% and 87%, respectively. These figures indicate a sustained effort and commitment to improving child health through vaccinations, demonstrating the effectiveness of ongoing health initiatives in these regions.
Overall, the data reveals a steady improvement in vaccination rates across all three areas, highlighting the success of public health strategies aimed at increasing vaccine coverage among children.
Bài mẫu 2
Overview: Overall, vaccination rates increased in all three areas from January to March. Area A consistently had the highest rates each month, while Area B had the lowest rates. The differences between the areas were relatively small but notable.
Body 1: In January, the vaccination rates were 85% in Area A, 78% in Area B, and 82% in Area C. Area A led with the highest percentage, followed by Area C, and then Area B. In February, all areas saw an increase in their vaccination rates. Area A’s rate rose to 88%, Area B’s to 81%, and Area C’s to 85%. Despite the increase, the ranking order remained the same, with Area A having the highest rates and Area B the lowest.
Body 2: By March, the vaccination rates further improved across all areas. Area A achieved a rate of 90%, maintaining its lead. Area C followed with 87%, while Area B had the lowest rate at 83%. The upward trend in vaccination rates suggests successful efforts in increasing child immunization in all three areas, with Area A showing the most significant improvement over the three-month period.
In conclusion, the data indicates a positive trend in vaccination rates across all three areas, with Area A consistently leading and Area B having the most ground to cover to match the rates of the other areas.