IELTS Writing Task 1 yêu cầu mô tả biểu đồ về tăng trưởng GDP của bốn thành phố từ năm 2011 đến 2021. Thí sinh cần phân tích xu hướng, so sánh sự khác biệt và tương đồng trong dữ liệu. Bài viết cần rõ ràng, mạch lạc và sử dụng ngôn ngữ chính xác, phù hợp với ngữ cảnh biểu đồ.
Bạn có thể đọc lại bài nói về Task 1 tại đây: IELTS Writing Task 1 cần lưu ý những gì?
Bạn cũng có thể đọc thêm bài viết này vì đề bài này là IELTS Writing Task 1 biểu đồ Line Graph.
IELTS Writing Task 1 Line Graph
You should spent about 20 mintutes on this task
IELTS Writing Task 1 requires describing a chart about GDP growth of four cities from 2011 to 2021. Candidates need to analyze trends, compare differences and similarities in the data. The writing should be clear, coherent, and use precise language appropriate to the context of the chart.
You should write at least 150 words.
| Năm | Thành phố A | Thành phố B | Thành phố C | Thành phố D |
| 2011 | 3.5% | 4.0% | 2.8% | 3.2% |
| 2012 | 3.8% | 4.2% | 3.0% | 3.4% |
| 2013 | 4.0% | 4.5% | 3.2% | 3.6% |
| 2014 | 4.2% | 4.8% | 3.4% | 3.8% |
| 2015 | 4.5% | 5.0% | 3.6% | 4.0% |
| 2016 | 4.7% | 5.3% | 3.8% | 4.2% |
| 2017 | 5.0% | 5.5% | 4.0% | 4.4% |
| 2018 | 5.2% | 5.7% | 4.2% | 4.6% |
| 2019 | 5.5% | 5.9% | 4.4% | 4.8% |
| 2020 | 2.5% | 3.0% | 1.8% | 2.0% |
| 2021 | 3.0% | 3.5% | 2.2% | 2.5% |

Bài tham khảo 1
Introduction:
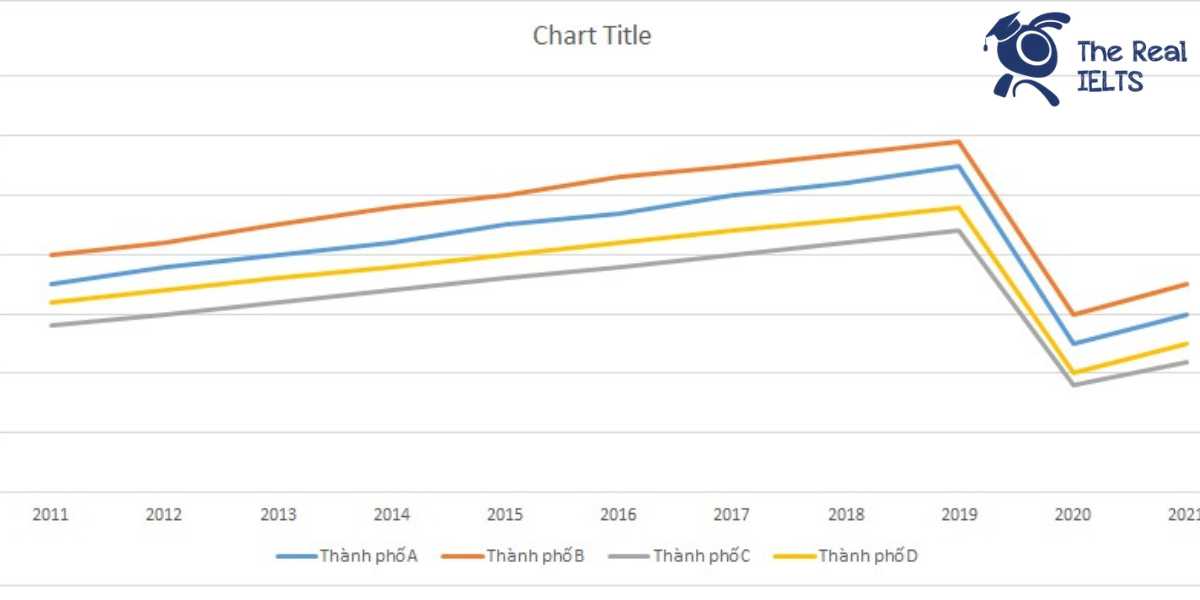
The line graph illustrates the GDP growth rates of four cities—City A, City B, City C, and City D—from 2011 to 2021.
Overview:
Overall, all four cities experienced a general increase in GDP growth from 2011 to 2019, followed by a significant decline in 2020. By 2021, the growth rates had started to recover but did not reach the pre-2020 levels.
Body 1:
From 2011 to 2019, City B consistently had the highest GDP growth rate, rising from 4.0% in 2011 to 5.9% in 2019. City A followed, with its GDP growth increasing from 3.5% to 5.5% over the same period. City C and City D had lower growth rates compared to Cities A and B. City C’s GDP growth increased from 2.8% in 2011 to 4.4% in 2019, while City D’s growth rose from 3.2% to 4.8%.
Body 2:
In 2020, all cities experienced a sharp decline in GDP growth due to likely external economic factors. City A’s growth dropped from 5.5% in 2019 to 2.5% in 2020, City B’s from 5.9% to 3.0%, City C’s from 4.4% to 1.8%, and City D’s from 4.8% to 2.0%. In 2021, a recovery began, with GDP growth rates for City A, City B, City C, and City D reaching 3.0%, 3.5%, 2.2%, and 2.5%, respectively. However, these rates remained below the pre-2020 levels.
Bài tham khảo 2
Introduction
The line graph illustrates the GDP growth rates from 2011 to 2021 for four cities: City A, City B, City C, and City D.
Overview
Overall, all four cities experienced a general upward trend in GDP growth from 2011 to 2019, followed by a significant decline in 2020. In 2021, there was a slight recovery in GDP growth rates across all cities. City B consistently had the highest GDP growth rate, while City C had the lowest.
Body 1
From 2011 to 2019, City B maintained a steady increase in its GDP growth rate, rising from 4.0% in 2011 to 5.9% in 2019, the highest among the four cities. Similarly, City A saw a growth from 3.5% to 5.5% during the same period. City C and City D also followed a similar pattern, albeit with lower growth rates. City C’s GDP growth increased from 2.8% to 4.4%, and City D’s from 3.2% to 4.8%.
Body 2
In 2020, there was a notable decline in GDP growth rates for all cities, with City A dropping to 2.5%, City B to 3.0%, City C to 1.8%, and City D to 2.0%. However, by 2021, all cities showed a modest recovery. City B’s GDP growth rate increased to 3.5%, City A to 3.0%, City D to 2.5%, and City C to 2.2%. Despite the downturn in 2020, City B still led in terms of GDP growth throughout the entire period, while City C remained the lowest.
Bài tham khảo 3
Introduction
The line graph illustrates the growth rate of GDP in four cities—City A, City B, City C, and City D—over a ten-year period from 2011 to 2021.
Overview
Overall, the GDP growth rates for all four cities experienced an upward trend from 2011 to 2019, followed by a significant decline in 2020. Although there was a slight recovery in 2021, the growth rates did not return to the pre-2020 levels.
Body 1
In 2011, City B had the highest GDP growth rate at 4.0%, while City C had the lowest at 2.8%. From 2011 to 2019, all four cities showed a steady increase in their GDP growth rates. By 2019, City B continued to lead with a growth rate of 5.9%, followed by City A at 5.5%, City D at 4.8%, and City C at 4.4%.
Body 2
However, in 2020, the growth rates for all four cities dropped sharply, with City A experiencing the most significant decline to 2.5%. City B’s growth rate fell to 3.0%, City C’s to 1.8%, and City D’s to 2.0%. In 2021, there was a minor recovery, with City B reaching a growth rate of 3.5%, City A at 3.0%, City D at 2.5%, and City C at 2.2%. Despite this recovery, the GDP growth rates in 2021 remained below the 2019 levels for all cities.