IELTS Writing Task 1 yêu cầu mô tả lượng tiêu thụ rượu bia hàng tháng trong năm 2021 của bốn quốc gia khác nhau. Đề bài cung cấp biểu đồ minh họa số liệu cụ thể, yêu cầu phân tích và so sánh mức tiêu thụ giữa các quốc gia, nhấn mạnh xu hướng chính và biến động đáng chú ý.
Bạn có thể đọc lại bài nói về Task 1 tại đây: IELTS Writing Task 1 cần lưu ý những gì?
Bạn cũng có thể đọc thêm bài viết này vì đề bài này là IELTS Writing Task 1 biểu đồ Line Graph.
Bạn cũng có thể Xây Dựng Lộ Trình Cá Nhân Hóa của mình tại link.
IELTS Writing Task 1 Line Graph: Alcohol
You should spent about 20 mintutes on this task
IELTS Writing Task 1 requires describing the monthly alcohol consumption in 2021 of four different countries. The task provides a chart illustrating specific data, requiring analysis and comparison of consumption levels between the countries, highlighting key trends and notable fluctuations.
You should write at least 150 words.
| Tháng | Quốc gia A (triệu lít) | Quốc gia B (triệu lít) | Quốc gia C (triệu lít) | Quốc gia D (triệu lít) |
| Tháng 1 | 50,000 | 30,000 | 45,000 | 25,000 |
| Tháng 2 | 48,000 | 28,000 | 43,000 | 24,000 |
| Tháng 3 | 55,000 | 35,000 | 50,000 | 27,000 |
| Tháng 4 | 53,000 | 33,000 | 48,000 | 26,000 |
| Tháng 5 | 60,000 | 40,000 | 55,000 | 30,000 |
| Tháng 6 | 58,000 | 38,000 | 53,000 | 29,000 |
| Tháng 7 | 65,000 | 45,000 | 60,000 | 35,000 |
| Tháng 8 | 63,000 | 43,000 | 58,000 | 34,000 |
| Tháng 9 | 70,000 | 50,000 | 65,000 | 40,000 |
| Tháng 10 | 68,000 | 48,000 | 63,000 | 38,000 |
| Tháng 11 | 75,000 | 55,000 | 70,000 | 45,000 |
| Tháng 12 | 73,000 | 53,000 | 68,000 | 44,000 |

Bài tham khảo 1
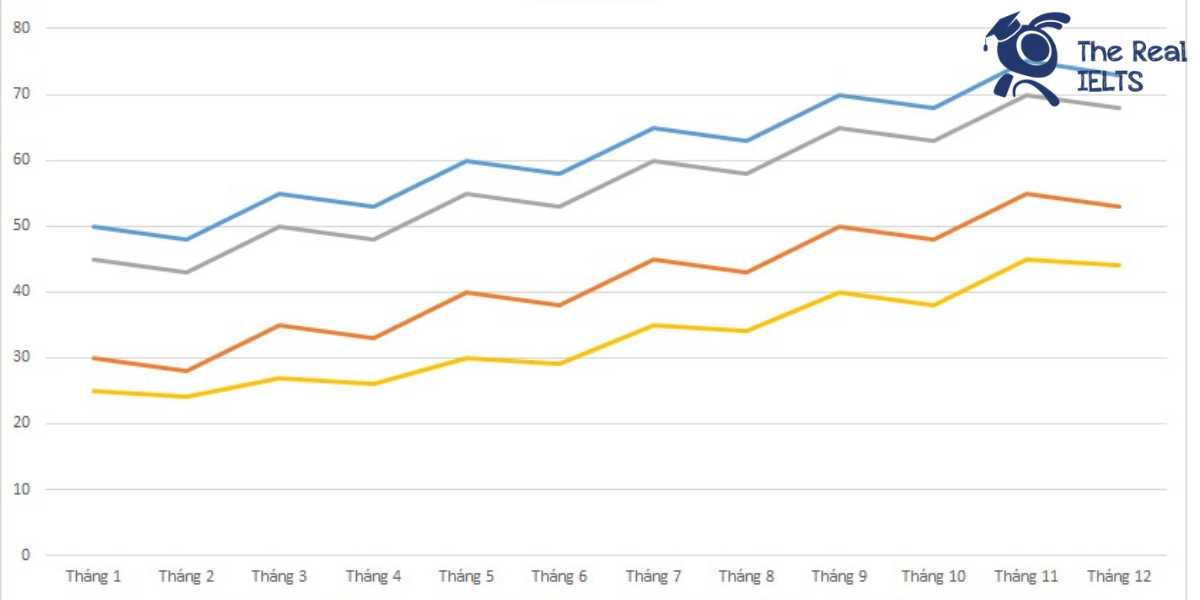
The table illustrates the monthly consumption of alcoholic beverages in four countries—A, B, C, and D—throughout the year 2021, measured in million liters.
Overall, it can be observed that the consumption in all four countries follows an upward trend, with the highest figures recorded in December. Country A consistently consumed the most alcohol, while Country D had the lowest consumption each month.
In the first half of the year, Country A’s alcohol consumption began at 50 million liters in January, slightly dropping to 48 million liters in February, before rising to 55 million liters in March. It continued to increase, reaching 60 million liters by May and slightly decreasing to 58 million liters in June. In contrast, Country B’s consumption started at 30 million liters in January and followed a similar fluctuating pattern, ending the first half at 38 million liters in June.
Country C’s monthly consumption ranged from 43 million liters in February to 55 million liters in May during the first half of the year. Country D, which had the lowest figures overall, started with 25 million liters in January and reached 29 million liters by June.
In the latter half of the year, consumption patterns showed continued growth. Country A saw its highest consumption in November at 75 million liters. Country B’s peak was also in November with 55 million liters. Country C and Country D also had their highest consumption in November, at 70 million liters and 45 million liters, respectively. By December, slight decreases were observed in most countries, but the figures remained high compared to the beginning of the year.
In conclusion, while all countries experienced a general increase in alcohol consumption over the year, Country A led consistently, and Country D had the lowest figures each month.
Bài tham khảo 2
The table illustrates the monthly alcohol consumption in four countries (Country A, Country B, Country C, and Country D) throughout the year 2021, measured in million liters.
Overall, it is evident that all four countries experienced a general increase in alcohol consumption over the year. Among these countries, Country A consistently had the highest consumption, while Country D had the lowest.
In the first half of the year, Country A’s consumption rose from 50 million liters in January to 58 million liters in June. Similarly, Country B’s consumption increased from 30 to 38 million liters, while Country C’s went from 45 to 53 million liters, and Country D’s from 25 to 29 million liters. This gradual rise indicates a steady growth in alcohol consumption across all four countries.
In the second half of the year, the trend continued with more significant increases. By December, Country A reached its peak consumption at 75 million liters. Country B also saw substantial growth, ending the year at 55 million liters. Country C’s consumption increased to 70 million liters, while Country D, despite having the lowest figures, also peaked at 45 million liters. This data suggests that alcohol consumption was consistently rising, with notable surges in the latter half of the year.
Bài tham khảo 3
The table provides data on the monthly alcohol consumption in four countries (Country A, B, C, and D) in 2021, measured in million liters.
Overall, Country A consistently consumed the most alcohol each month, while Country D had the lowest consumption. There is a clear upward trend in alcohol consumption for all countries over the year.
In January, Country A started with 50 million liters, which steadily increased to a peak of 75 million liters in November before slightly decreasing to 73 million liters in December. Similarly, Country B began with 30 million liters in January and showed a consistent rise, reaching 55 million liters in November and maintaining a slightly lower level of 53 million liters in December.
Country C followed a comparable pattern, starting at 45 million liters in January and peaking at 70 million liters in November. By December, its consumption slightly declined to 68 million liters. On the other hand, Country D, which had the lowest consumption throughout the year, began with 25 million liters in January and saw a gradual increase to 45 million liters in November, finishing the year at 44 million liters in December.
In conclusion, while all four countries exhibited an increasing trend in alcohol consumption throughout the year, Country A and B had higher consumption levels compared to Country C and D, with noticeable peaks in November.
Bài tham khảo 4
The table provides data on the monthly alcohol consumption in four countries throughout the year 2021, measured in million liters.
Overall, Country A consistently had the highest alcohol consumption each month, while Country D had the lowest. All countries showed an increasing trend in alcohol consumption towards the end of the year.
In the first six months, Country A’s alcohol consumption started at 50 million liters in January and slightly fluctuated before reaching 65 million liters in July. Country B followed a similar pattern, beginning at 30 million liters and peaking at 45 million liters in July. Country C’s consumption ranged from 45 million liters in January to 60 million liters in July. Meanwhile, Country D’s figures were comparatively lower, starting at 25 million liters and rising to 35 million liters in July.
From August to December, all countries continued to show growth. Country A’s consumption peaked at 75 million liters in November before slightly declining to 73 million liters in December. Country B’s numbers increased to a high of 55 million liters in November, then dipped slightly to 53 million liters in December. Country C saw a peak of 70 million liters in November, slightly decreasing to 68 million liters in December. Country D also reached its highest consumption of 45 million liters in November, dropping slightly to 44 million liters in December.
Overall, the data shows a clear upward trend in alcohol consumption in all four countries throughout 2021, with peaks typically occurring in November.
Bài tham khảo 5
The table provides monthly data on alcohol consumption (in million liters) in four countries (A, B, C, and D) for the year 2021.
Overview: Overall, the data indicate that Country A consistently consumed the highest amount of alcohol each month, followed by Countries C, B, and D. All four countries showed an upward trend in alcohol consumption towards the end of the year, with peaks generally occurring in December.
Body 1: Country A’s alcohol consumption started at 50 million liters in January and showed a steady increase, reaching a peak of 75 million liters in November. Similarly, Country C, which had the second-highest consumption, began with 45 million liters in January and peaked at 70 million liters in November.
Body 2: Country B and Country D had comparatively lower levels of consumption. Country B’s monthly consumption started at 30 million liters in January, peaked at 55 million liters in November, and ended the year slightly lower at 53 million liters in December. Country D, with the lowest consumption figures, began the year at 25 million liters in January, reaching its peak at 45 million liters in November, and concluded December with 44 million liters.
In summary, while all four countries showed a general increase in alcohol consumption over the year, Country A had the highest overall consumption each month, with a notable peak in November across all countries.