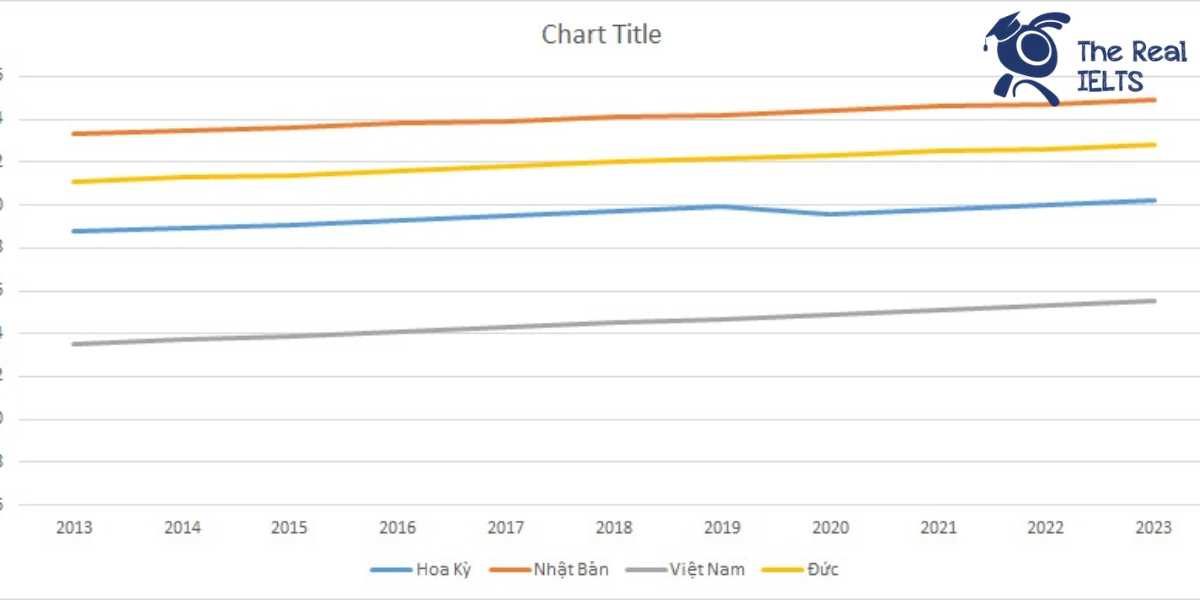
IELTS Writing Task 1 Line Graph: Average Life: Bài viết mô tả đồ thị đường biểu diễn tuổi thọ trung bình của bốn quốc gia: Hoa Kỳ, Nhật Bản, Việt Nam và Đức, từ năm 2013. Đồ thị cho thấy xu hướng thay đổi qua các năm, giúp so sánh và phân tích sự khác biệt về tuổi thọ giữa các quốc gia này.
Bạn có thể đọc lại bài nói về Task 1 tại đây: IELTS Writing Task 1 cần lưu ý những gì?
Bạn cũng có thể đọc thêm bài viết này vì đề bài này là IELTS Writing Task 1 biểu đồ Line Graph.
IELTS Writing Task 1 Line Graph: Average Life
You should spent about 20 mintutes on this task
The essay describes the line graph depicting the average life expectancy of four countries: the United States, Japan, Vietnam, and Germany, from 2013. The graph shows the trends over the years, facilitating comparison and analysis of the differences in life expectancy among these countries.
You should write at least 150 words.
| Năm | Hoa Kỳ | Nhật Bản | Việt Nam | Đức |
| 2013 | 78.8 | 83.3 | 73.5 | 81.1 |
| 2014 | 78.9 | 83.5 | 73.7 | 81.3 |
| 2015 | 79.1 | 83.6 | 73.9 | 81.4 |
| 2016 | 79.3 | 83.8 | 74.1 | 81.6 |
| 2017 | 79.5 | 83.9 | 74.3 | 81.8 |
| 2018 | 79.7 | 84.1 | 74.5 | 82 |
| 2019 | 79.9 | 84.2 | 74.7 | 82.2 |
| 2020 | 79.6 | 84.4 | 74.9 | 82.3 |
| 2021 | 79.8 | 84.6 | 75.1 | 82.5 |
| 2022 | 80 | 84.7 | 75.3 | 82.6 |
| 2023 | 80.2 | 84.9 | 75.5 | 82.8 |

Bài tham khảo 1
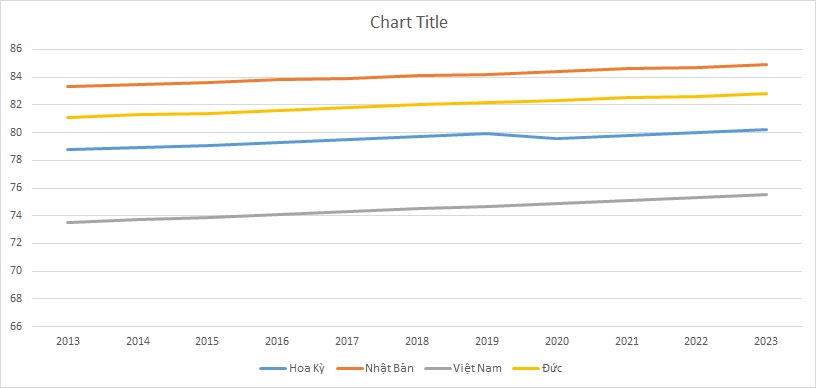
The line graph illustrates the average life expectancy in the United States, Japan, Vietnam, and Germany from 2013 to 2023.
Overall, Japan consistently had the highest life expectancy throughout the period, while Vietnam had the lowest. However, all four countries showed an upward trend in life expectancy over the ten years.
In 2013, the average life expectancy in Japan was the highest at 83.3 years, followed by Germany at 81.1 years, the United States at 78.8 years, and Vietnam at 73.5 years. Over the next decade, Japan saw a steady increase, reaching 84.9 years in 2023. Similarly, Germany’s life expectancy rose consistently, reaching 82.8 years in 2023.
The United States experienced a more modest increase in life expectancy. Starting at 78.8 years in 2013, it rose to 80.2 years by 2023. Vietnam, while having the lowest life expectancy, showed significant improvement over the decade. Beginning at 73.5 years in 2013, Vietnam’s life expectancy increased steadily each year, reaching 75.5 years in 2023.
In summary, while Japan maintained the highest life expectancy, all four countries experienced growth in average life expectancy from 2013 to 2023, with Vietnam showing notable progress.
Bài tham khảo 2
The line graph illustrates the average life expectancy in four countries – the United States, Japan, Vietnam, and Germany – from 2013 to 2023.
Overall, Japan consistently had the highest life expectancy throughout the period, followed by Germany, the United States, and Vietnam. All four countries saw an upward trend in life expectancy over the ten-year span, although there were some fluctuations, particularly in the United States.
In 2013, Japan had the highest life expectancy at 83.3 years, while Vietnam had the lowest at 73.5 years. Over the next decade, Japan’s life expectancy steadily increased, reaching 84.9 years in 2023. Germany also showed a consistent rise from 81.1 years in 2013 to 82.8 years in 2023, maintaining its position as the country with the second-highest life expectancy.
The United States experienced a more varied trend. Starting at 78.8 years in 2013, the life expectancy increased to 79.9 years by 2019 but then saw a slight dip to 79.6 years in 2020, likely due to external factors such as the COVID-19 pandemic. However, it rebounded to 80.2 years by 2023. Vietnam showed the most significant improvement among the four countries, with life expectancy rising from 73.5 years in 2013 to 75.5 years in 2023.
In summary, while all four countries experienced increases in life expectancy from 2013 to 2023, Japan and Germany consistently had higher averages, with Vietnam showing the most significant overall growth.
Bài tham khảo 3
Introduction
The line graph illustrates the changes in average life expectancy from 2013 to 2023 in four countries: the United States, Japan, Vietnam, and Germany.
Overview
Overall, Japan consistently had the highest life expectancy throughout the period, while Vietnam had the lowest. All four countries showed an upward trend in life expectancy, although the rate of increase varied among them.
Body 1
In 2013, Japan had the highest life expectancy at 83.3 years, followed by Germany at 81.1 years, the United States at 78.8 years, and Vietnam at 73.5 years. Over the ten-year period, Japan’s life expectancy rose steadily, reaching 84.9 years in 2023. Germany also saw a significant increase, with life expectancy rising from 81.1 years in 2013 to 82.8 years in 2023.
Body 2
The United States experienced a slower increase in life expectancy compared to Japan and Germany. Starting at 78.8 years in 2013, it reached 80.2 years by 2023. Meanwhile, Vietnam showed the most remarkable improvement, albeit from the lowest base. Vietnamese life expectancy increased from 73.5 years in 2013 to 75.5 years in 2023, reflecting steady progress over the decade. Despite these gains, Vietnam still had the lowest life expectancy among the four countries throughout the period.


