IELTS Writing Task 1 yêu cầu mô tả biểu đồ lượng tiêu thụ thịt bò hàng tháng trong năm 2021 của bốn quốc gia. Thí sinh cần phân tích xu hướng, so sánh sự khác biệt giữa các quốc gia và nêu rõ các điểm đáng chú ý. Bài viết phải có cấu trúc rõ ràng và ngôn ngữ mạch lạc.
Bạn có thể đọc lại bài nói về Task 1 tại đây: IELTS Writing Task 1 cần lưu ý những gì?
Bạn cũng có thể đọc thêm bài viết này vì đề bài này là IELTS Writing Task 1 biểu đồ Line Graph.
Bạn cũng có thể Xây Dựng Lộ Trình Cá Nhân Hóa của mình tại link.
IELTS Writing Task 1 Line Graph: Beef Consumption
You should spent about 20 mintutes on this task
IELTS Writing Task 1 requires describing a chart of monthly beef consumption in 2021 for four countries. Candidates need to analyze trends, compare differences between countries, and highlight notable points. The essay must have a clear structure and coherent language.
You should write at least 150 words.
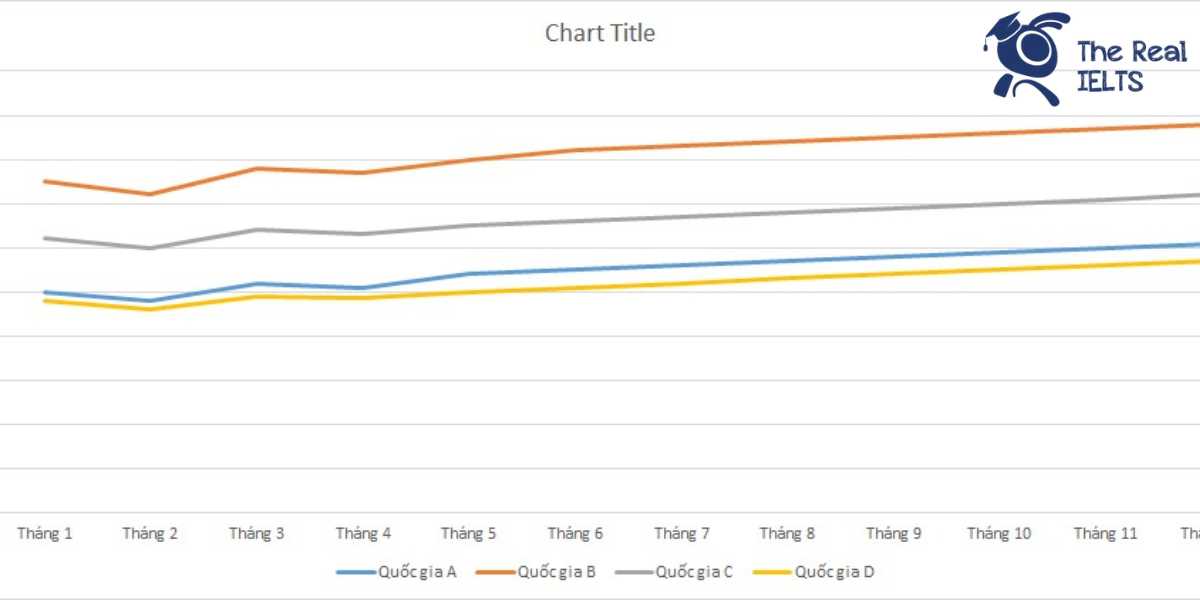
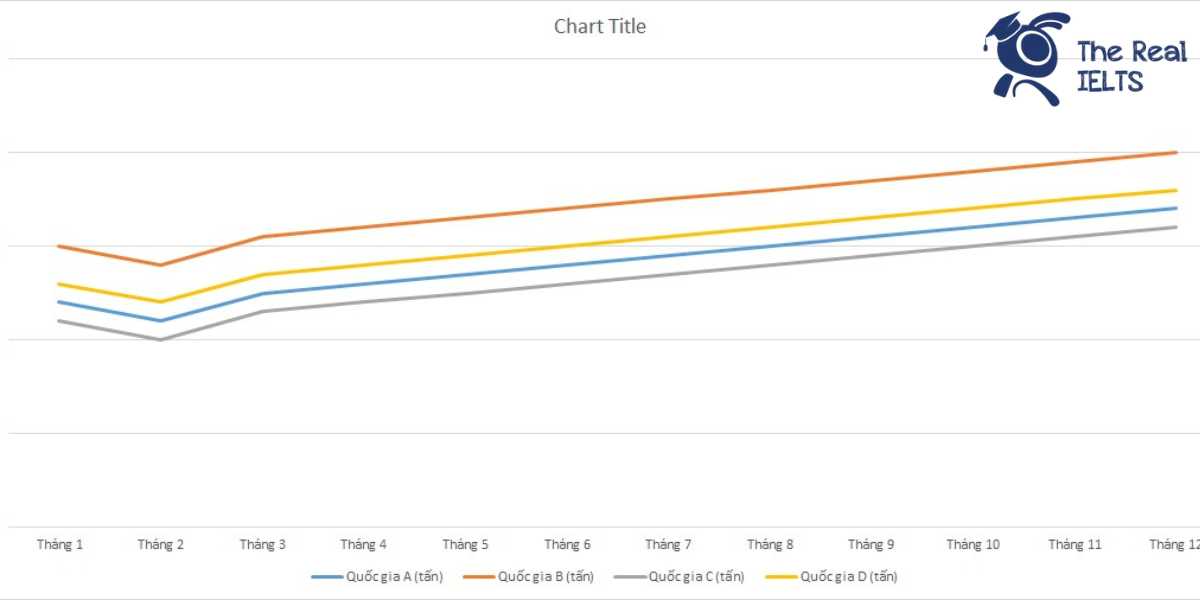
| Tháng | Quốc gia A (tấn) | Quốc gia B (tấn) | Quốc gia C (tấn) | Quốc gia D (tấn) |
| Tháng 1 | 1200 | 1500 | 1100 | 1300 |
| Tháng 2 | 1100 | 1400 | 1000 | 1200 |
| Tháng 3 | 1250 | 1550 | 1150 | 1350 |
| Tháng 4 | 1300 | 1600 | 1200 | 1400 |
| Tháng 5 | 1350 | 1650 | 1250 | 1450 |
| Tháng 6 | 1400 | 1700 | 1300 | 1500 |
| Tháng 7 | 1450 | 1750 | 1350 | 1550 |
| Tháng 8 | 1500 | 1800 | 1400 | 1600 |
| Tháng 9 | 1550 | 1850 | 1450 | 1650 |
| Tháng 10 | 1600 | 1900 | 1500 | 1700 |
| Tháng 11 | 1650 | 1950 | 1550 | 1750 |
| Tháng 12 | 1700 | 2000 | 1600 | 1800 |

Bài tham khảo 1
Introduction
The table illustrates the monthly beef consumption in 2021 for four countries: Country A, Country B, Country C, and Country D.
Overview
Overall, beef consumption in all four countries showed an upward trend throughout the year. Country B consistently had the highest consumption, while Country C had the lowest.
Body 1
In January, the consumption of beef was highest in Country B with 1500 tons and lowest in Country C with 1100 tons. Country A and Country D consumed 1200 tons and 1300 tons respectively. As the months progressed, all four countries saw a gradual increase in their beef consumption. By June, the figures had risen to 1400 tons for Country A, 1700 tons for Country B, 1300 tons for Country C, and 1500 tons for Country D.
Body 2
The upward trend continued in the latter half of the year. In December, Country B reached a peak consumption of 2000 tons, followed by Country D with 1800 tons, Country A with 1700 tons, and Country C with 1600 tons. The consistent rise in beef consumption across all four countries highlights a steady demand throughout the year, with Country B maintaining its position as the largest consumer and Country C as the smallest.
Bài tham khảo 2
Introduction
The table presents the monthly beef consumption in tons for four countries (A, B, C, and D) throughout the year 2021.
Overview
Overall, all four countries showed an upward trend in beef consumption from January to December. Country B consistently consumed the highest amount of beef each month, while Country C had the lowest consumption.
Body 1
At the beginning of the year in January, Country B had the highest beef consumption at 1500 tons, followed by Country D at 1300 tons, Country A at 1200 tons, and Country C at 1100 tons. This pattern of Country B leading in beef consumption persisted throughout the year. By June, the consumption figures rose to 1700 tons in Country B, 1400 tons in Country A, 1500 tons in Country D, and 1300 tons in Country C.
Body 2
In the latter half of the year, the trend of increasing beef consumption continued. In December, Country B reached the peak consumption of 2000 tons. Country A, which started the year with the lowest consumption among the four countries, saw a steady increase, reaching 1700 tons. Country D followed a similar trend, ending the year with 1800 tons, while Country C had a more moderate increase, concluding with 1600 tons in December.
In summary, while all four countries exhibited an upward trend in beef consumption over the year, Country B consistently consumed the most, and Country C the least.
Bài tham khảo 3
Introduction:
The table provides a detailed overview of the monthly beef consumption (in tonnes) in four countries (A, B, C, and D) throughout the year 2021.
Overview:
Overall, beef consumption in all four countries shows an upward trend from January to December. Country B consistently recorded the highest monthly consumption, while Country C had the lowest figures each month.
Body 1:
In January, Country B led with 1500 tonnes, followed by Country D with 1300 tonnes, Country A with 1200 tonnes, and Country C with 1100 tonnes. The following months showed a steady increase in consumption across all countries. By mid-year, in June, the consumption for Countries A, B, C, and D rose to 1400, 1700, 1300, and 1500 tonnes respectively.
Body 2:
The latter half of the year continued the increasing trend. By December, the figures reached their peak, with Country B consuming 2000 tonnes, Country D at 1800 tonnes, Country A at 1700 tonnes, and Country C at 1600 tonnes. Notably, the difference between the highest and lowest consumers (Countries B and C) remained significant throughout the year, indicating consistent consumption patterns.
In conclusion, the data illustrates a continuous rise in beef consumption in all four countries, with Country B leading and Country C trailing each month.
Bài tham khảo 4
Introduction
The table presents the monthly beef consumption in 2021 for four countries: A, B, C, and D. The data is measured in tons and spans from January to December.
Overview
Overall, it is evident that beef consumption in all four countries shows a steady upward trend throughout the year. Country B consistently records the highest consumption each month, while Country C has the lowest figures.
Body 1
In January, Country A consumes 1200 tons of beef, Country B 1500 tons, Country C 1100 tons, and Country D 1300 tons. By mid-year, in June, consumption has increased to 1400 tons for Country A, 1700 tons for Country B, 1300 tons for Country C, and 1500 tons for Country D. This represents a noticeable rise in consumption in all countries over the first half of the year.
Body 2
By December, the final month of the year, the beef consumption peaks at 1700 tons for Country A, 2000 tons for Country B, 1600 tons for Country C, and 1800 tons for Country D. This consistent growth indicates a strong and increasing demand for beef in these countries throughout 2021. Country B maintains its position as the highest consumer, while the other countries show significant but smaller increases in their consumption rates.
Bài tham khảo 5
Introduction
Bảng dưới đây hiển thị dữ liệu về lượng tiêu thụ thịt bò hàng tháng trong năm 2021 của bốn quốc gia: Quốc gia A, Quốc gia B, Quốc gia C và Quốc gia D.
Overview
Nhìn chung, lượng tiêu thụ thịt bò của cả bốn quốc gia đều có xu hướng tăng dần theo thời gian. Trong suốt năm, Quốc gia B luôn có mức tiêu thụ cao nhất, trong khi Quốc gia C luôn có mức tiêu thụ thấp nhất.
Body 1
Trong ba tháng đầu năm, lượng tiêu thụ thịt bò của Quốc gia A và Quốc gia B có sự biến động nhỏ. Quốc gia A tăng từ 1200 tấn vào tháng 1 lên 1250 tấn vào tháng 3, trong khi Quốc gia B tăng từ 1500 tấn lên 1550 tấn. Quốc gia C và Quốc gia D cũng có xu hướng tương tự với mức tăng từ 1100 tấn lên 1150 tấn và từ 1300 tấn lên 1350 tấn tương ứng.
Body 2
Từ tháng 4 đến tháng 12, lượng tiêu thụ thịt bò của cả bốn quốc gia tiếp tục tăng. Quốc gia A tăng từ 1300 tấn vào tháng 4 lên 1700 tấn vào tháng 12. Quốc gia B có mức tăng đáng kể nhất, từ 1600 tấn lên 2000 tấn. Quốc gia C và Quốc gia D cũng tăng từ 1200 tấn và 1400 tấn vào tháng 4 lên 1600 tấn và 1800 tấn vào tháng 12 tương ứng.