IELTS Writing Task 1 Line Graph: Biểu đồ đường biểu thị tỷ lệ sinh đẻ qua các năm cho thấy sự biến đổi đáng kể trong xu hướng sinh sản của một quốc gia. Dữ liệu cung cấp cái nhìn chi tiết về sự thay đổi trong hành vi sinh sản, cho phép phân tích các yếu tố xã hội và kinh tế ảnh hưởng đến quyết định sinh con.
Bạn có thể đọc lại bài nói về Task 1 tại đây: IELTS Writing Task 1 cần lưu ý những gì?
Bạn cũng có thể đọc thêm bài viết này vì đề bài này là IELTS Writing Task 1 biểu đồ Line Graph.
IELTS Writing Task 1 Line Graph: birth rates
You should spent about 20 mintutes on this task
IELTS Writing Task 1 Line Graph: The line graph depicting birth rates over the years shows significant changes in a country’s fertility trends. The data provides a detailed view of the shifts in reproductive behavior, allowing for the analysis of social and economic factors influencing childbirth decisions.
You should write at least 150 words.
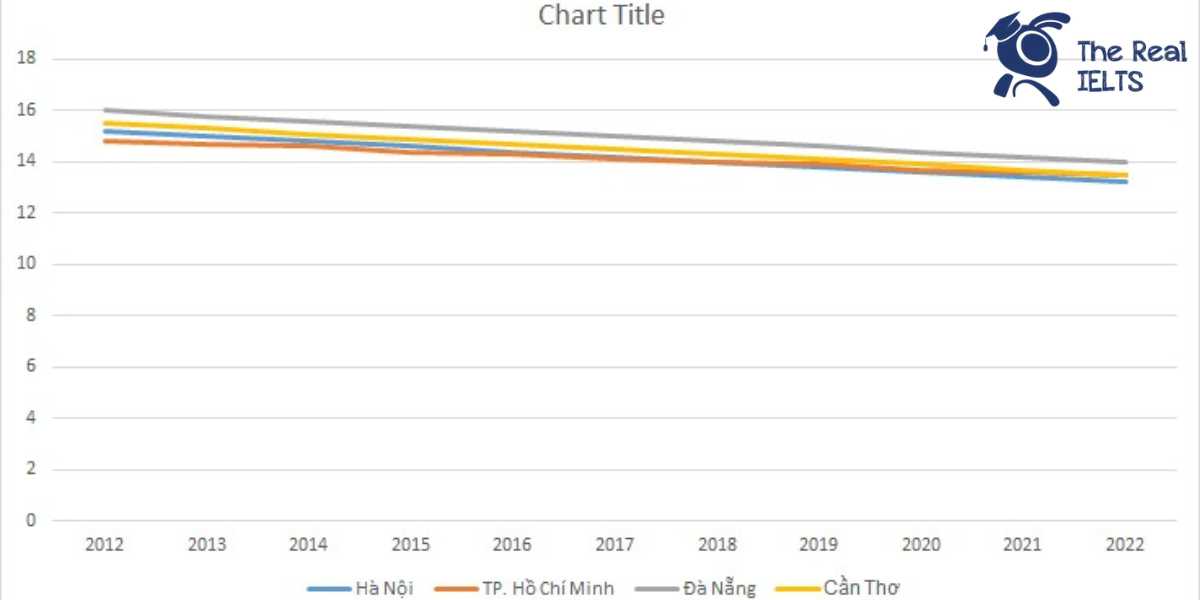
| Năm | Hà Nội | TP. Hồ Chí Minh | Đà Nẵng | Cần Thơ |
| 2012 | 15.2 | 14.8 | 16.0 | 15.5 |
| 2013 | 15.0 | 14.7 | 15.8 | 15.3 |
| 2014 | 14.8 | 14.6 | 15.6 | 15.1 |
| 2015 | 14.6 | 14.4 | 15.4 | 14.9 |
| 2016 | 14.4 | 14.3 | 15.2 | 14.7 |
| 2017 | 14.2 | 14.1 | 15.0 | 14.5 |
| 2018 | 14.0 | 14.0 | 14.8 | 14.3 |
| 2019 | 13.8 | 13.9 | 14.6 | 14.1 |
| 2020 | 13.6 | 13.7 | 14.4 | 13.9 |
| 2021 | 13.4 | 13.6 | 14.2 | 13.7 |
| 2022 | 13.2 | 13.5 | 14.0 | 13.5 |

Bài Writing tham khảo 1
The line graph illustrates the birth rates in four major cities of Vietnam—Hanoi, Ho Chi Minh City, Da Nang, and Can Tho—from 2012 to 2022.
Overall, it is evident that the birth rates in all four cities experienced a downward trend over the given period. Among the cities, Hanoi consistently had the highest birth rates, while Ho Chi Minh City had the lowest rates throughout the years.
In 2012, Hanoi started with a birth rate of 15.2, which was slightly higher than Can Tho at 15.5, and Da Nang had the highest rate at 16.0. Ho Chi Minh City, on the other hand, had a birth rate of 14.8. By 2015, the birth rates had decreased in all cities, with Hanoi at 14.6, Ho Chi Minh City at 14.4, Da Nang at 15.4, and Can Tho at 14.9.
The declining trend continued in the latter years. By 2018, the birth rate in Hanoi dropped to 14.0, while Ho Chi Minh City and Can Tho both had rates at 14.0 and 14.3, respectively. Da Nang’s birth rate decreased to 14.8. The year 2022 saw the lowest birth rates in the period for all cities: Hanoi at 13.2, Ho Chi Minh City at 13.5, Da Nang at 14.0, and Can Tho at 13.5.
In conclusion, the data indicates a steady decline in birth rates across all four cities over the ten-year span, with Hanoi maintaining the highest rates and Ho Chi Minh City the lowest, though all cities showed similar patterns of reduction.
Bài Writing tham khảo 2
The line graph illustrates the birth rates in four major cities in Vietnam: Hanoi, Ho Chi Minh City, Da Nang, and Can Tho, over a period from 2012 to 2022.
Overall, there was a general decline in birth rates across all four cities during this period. Hanoi consistently had the highest birth rate, while Ho Chi Minh City had the lowest. The birth rates in Da Nang and Can Tho showed similar trends but with Da Nang maintaining a slightly higher rate compared to Can Tho.
In 2012, Hanoi had the highest birth rate at 15.2, followed by Can Tho at 15.5, Da Nang at 16.0, and Ho Chi Minh City at 14.8. Over the next few years, all cities experienced a gradual decline. By 2015, the birth rates had decreased to 14.6 in Hanoi, 14.4 in Ho Chi Minh City, 15.4 in Da Nang, and 14.9 in Can Tho.
From 2016 onwards, the downward trend continued. By 2018, birth rates were 14.0 in Hanoi, 14.0 in Ho Chi Minh City, 14.8 in Da Nang, and 14.3 in Can Tho. The decline persisted, and by the end of the period in 2022, Hanoi’s birth rate had fallen to 13.2, Ho Chi Minh City’s to 13.5, Da Nang’s to 14.0, and Can Tho’s to 13.5.
In summary, all four cities witnessed a steady decrease in birth rates over the decade, with Hanoi having the highest rates and Ho Chi Minh City the lowest. The data suggests a uniform downward trend in urban birth rates across these major Vietnamese cities.
Bài Writing tham khảo 3
The line graph illustrates the birth rates of four major cities in Vietnam, namely Hanoi, Ho Chi Minh City, Da Nang, and Can Tho, over an 11-year period from 2012 to 2022.
Overall, it is evident that the birth rates in all four cities showed a consistent downward trend throughout the period. Among these cities, Da Nang consistently had the highest birth rates, while Ho Chi Minh City had the lowest.
In 2012, Hanoi’s birth rate stood at 15.2, slightly higher than Ho Chi Minh City’s 14.8. Da Nang and Can Tho had higher birth rates, at 16.0 and 15.5 respectively. Over the years, Hanoi experienced a gradual decrease, reaching 13.2 by 2022. Similarly, Ho Chi Minh City’s birth rate dropped from 14.8 to 13.5 within the same period.
In Da Nang, the birth rate decreased from 16.0 in 2012 to 14.0 in 2022, maintaining the highest rate among the four cities each year. Can Tho also saw a decline from 15.5 to 13.5 over the 11 years, with the birth rate closely following that of Hanoi.
In conclusion, all four major Vietnamese cities experienced a decline in birth rates from 2012 to 2022. Da Nang maintained the highest birth rates, while Ho Chi Minh City had the lowest throughout the period.