IELTS Writing Task 1 yêu cầu mô tả tỷ lệ sinh hàng năm của bốn quốc gia trong năm 2022. Bài viết cần phân tích và so sánh dữ liệu, nêu rõ xu hướng chính, sự khác biệt và tương đồng. Việc sử dụng từ ngữ chính xác và biểu đồ minh họa sẽ giúp người đọc dễ dàng hiểu và theo dõi thông tin.
Bạn có thể đọc lại bài nói về Task 1 tại đây: IELTS Writing Task 1 cần lưu ý những gì?
Bạn cũng có thể đọc thêm bài viết này vì đề bài này là IELTS Writing Task 1 biểu đồ Line Graph.
IELTS Writing Task 1 Line Graph: Birth Rates 2
You should spent about 20 mintutes on this task
IELTS Writing Task 1 requires describing the annual birth rates of four countries in 2022. The essay needs to analyze and compare the data, highlighting key trends, differences, and similarities. Using precise language and illustrative charts will help readers easily understand and follow the information.
You should write at least 150 words.
| Năm | Quốc gia A | Quốc gia B | Quốc gia C | Quốc gia D |
| 2010 | 18.5 | 12.3 | 14.8 | 16.7 |
| 2011 | 18.3 | 12.5 | 14.6 | 16.5 |
| 2012 | 18.1 | 12.7 | 14.4 | 16.3 |
| 2013 | 17.9 | 12.9 | 14.2 | 16.1 |
| 2014 | 17.7 | 13.1 | 14.0 | 15.9 |
| 2015 | 17.5 | 13.3 | 13.8 | 15.7 |
| 2016 | 17.3 | 13.5 | 13.6 | 15.5 |
| 2017 | 17.1 | 13.7 | 13.4 | 15.3 |
| 2018 | 16.9 | 13.9 | 13.2 | 15.1 |
| 2019 | 16.7 | 14.1 | 13.0 | 14.9 |
| 2020 | 16.5 | 14.3 | 12.8 | 14.7 |
| 2021 | 16.3 | 14.5 | 12.6 | 14.5 |
| 2022 | 16.1 | 14.7 | 12.4 | 14.3 |

Bài tham khảo 1
Introduction
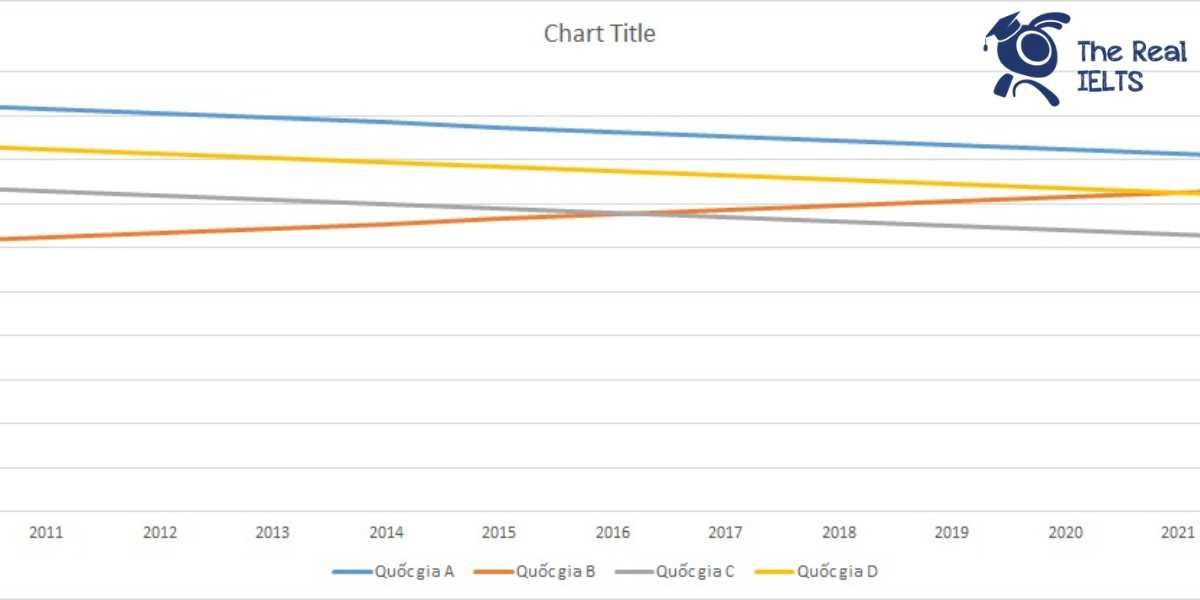
The line graph illustrates the annual birth rates of four countries, namely Country A, Country B, Country C, and Country D, over a period from 2010 to 2022.
Overview
Overall, it is evident that all four countries experienced a decline in birth rates over the given period. However, the rate of decline and the starting and ending birth rates varied significantly among these countries. Country A had the highest birth rate throughout the period, while Country C had the lowest by the end of 2022.
Body 1
In 2010, Country A started with the highest birth rate of 18.5, followed by Country D with 16.7, Country C with 14.8, and Country B with 12.3. Over the years, Country A saw a steady decrease in its birth rate, ending at 16.1 in 2022. This represents a total decline of 2.4 over the 12-year period. Country D also experienced a gradual decline, though at a slower pace, reaching 14.3 by 2022.
Body 2
Country B and Country C showed slightly different trends. Country B’s birth rate increased marginally from 12.3 in 2010 to 14.7 in 2022, showing a contrasting trend compared to the other countries. On the other hand, Country C’s birth rate decreased steadily from 14.8 in 2010 to 12.4 in 2022. Despite the fluctuations, the overall trend for Country C was a decline, making it the country with the lowest birth rate by the end of the period.
Conclusion
In summary, while Countries A, C, and D exhibited a declining trend in birth rates, Country B’s birth rate showed a slight increase, making it an outlier among the four countries. The data highlights the varying demographic changes occurring in these countries over the specified period.
Bài tham khảo 2
Introduction
The line graph illustrates the annual birth rates in four countries (Country A, Country B, Country C, and Country D) from 2010 to 2022.
Overview
Overall, it can be observed that the birth rates in all four countries experienced a gradual decline over the given period. Country A consistently had the highest birth rate, while Country B showed an upward trend. In contrast, the birth rates in Country C and Country D steadily decreased, with Country C witnessing the most significant drop.
Body 1
In 2010, Country A had the highest birth rate at 18.5 per 1,000 people, followed by Country D at 16.7, Country C at 14.8, and Country B at 12.3. Over the next few years, Country A’s birth rate declined gradually, reaching 16.1 in 2022. Similarly, Country D’s birth rate decreased from 16.7 in 2010 to 14.3 in 2022, showing a consistent downward trend.
Body 2
Country C’s birth rate also showed a notable decline, starting at 14.8 in 2010 and falling to 12.4 by 2022. On the other hand, Country B’s birth rate exhibited a slight upward trend, increasing from 12.3 in 2010 to 14.7 in 2022. This upward movement in Country B’s birth rate contrasts with the overall downward trend observed in the other three countries.
In conclusion, while all four countries experienced fluctuations in birth rates, Country A maintained the highest rates throughout the period, and Country C had the most significant decrease. Country B was the only country to show an increasing trend in birth rates over the 12-year period.
Bài tham khảo 3
Introduction:
The line graph illustrates the annual birth rates in four countries (Country A, Country B, Country C, and Country D) over a period from 2010 to 2022.
Overview:
Overall, the birth rates in all four countries show a declining trend throughout the period. However, the decline is more pronounced in Country A and Country C, while Country B and Country D experience a relatively moderate decrease.
Body 1:
In 2010, Country A had the highest birth rate at 18.5, followed by Country D at 16.7, Country C at 14.8, and Country B at 12.3. Over the years, the birth rate in Country A steadily declined, reaching 16.1 by 2022. Country C also experienced a significant drop, from 14.8 in 2010 to 12.4 in 2022. The downward trend in both countries indicates a substantial decrease in birth rates over the 12-year period.
Body 2:
In contrast, the birth rates in Country B and Country D showed less dramatic decreases. Country B’s birth rate increased slightly from 12.3 in 2010 to 14.7 in 2022, with a consistent upward trend. Meanwhile, Country D’s birth rate decreased from 16.7 in 2010 to 14.3 in 2022, but the decline was more gradual compared to Country A and Country C. Despite the overall declining trend, Country B is the only nation that saw an increase in birth rates over the period.
In conclusion, the line graph highlights the variations in birth rate trends among the four countries, with a general downward trend observed in most nations, except for a slight increase in Country B.