IELTS Writing Task 1 yêu cầu thí sinh mô tả số lượng bài viết trên blog hàng tháng của 4 người khác nhau trong năm 2010. Dữ liệu thể hiện qua biểu đồ hoặc bảng, thí sinh phải phân tích và so sánh xu hướng, biến động số lượng bài viết của mỗi người theo từng tháng trong năm.
Bạn có thể đọc lại bài nói về Task 1 tại đây: IELTS Writing Task 1 cần lưu ý những gì?
Bạn cũng có thể đọc thêm bài viết này vì đề bài này là IELTS Writing Task 1 biểu đồ Line Graph.
IELTS Writing Task 1 Line Graph: Blog Posts
You should spent about 20 mintutes on this task
IELTS Writing Task 1 requires candidates to describe the monthly number of blog posts by four different individuals in 2010. The data is presented through a chart or table, and candidates must analyze and compare the trends and fluctuations in the number of posts for each person throughout the year.
You should write at least 150 words.
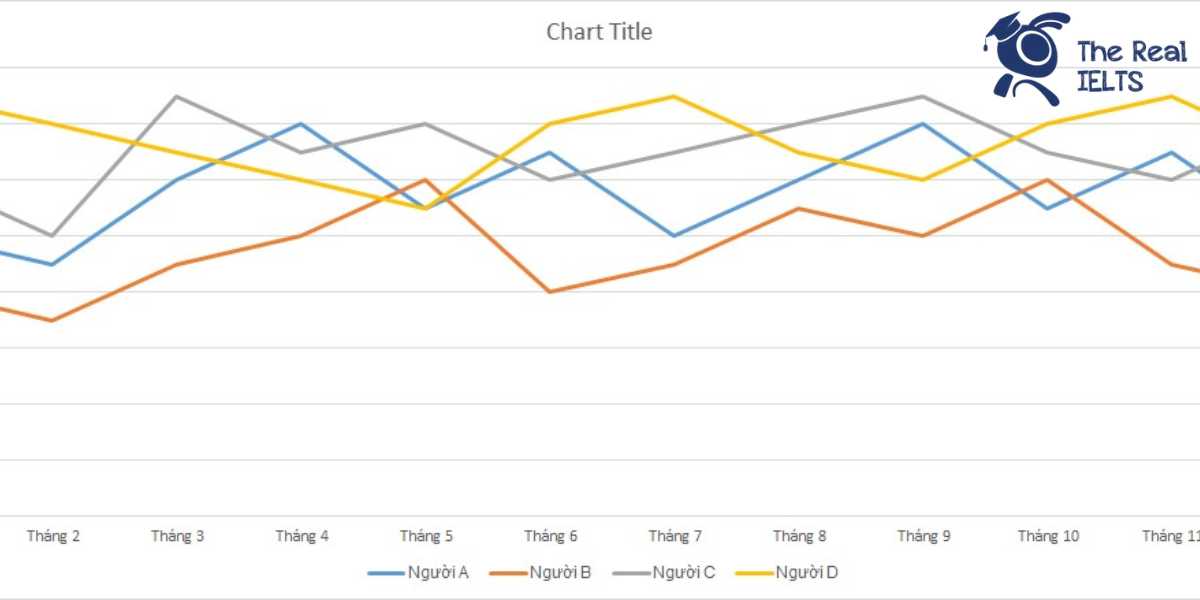
| Tháng | Người A | Người B | Người C | Người D |
| Tháng 1 | 10 | 8 | 12 | 15 |
| Tháng 2 | 9 | 7 | 10 | 14 |
| Tháng 3 | 12 | 9 | 15 | 13 |
| Tháng 4 | 14 | 10 | 13 | 12 |
| Tháng 5 | 11 | 12 | 14 | 11 |
| Tháng 6 | 13 | 8 | 12 | 14 |
| Tháng 7 | 10 | 9 | 13 | 15 |
| Tháng 8 | 12 | 11 | 14 | 13 |
| Tháng 9 | 14 | 10 | 15 | 12 |
| Tháng 10 | 11 | 12 | 13 | 14 |
| Tháng 11 | 13 | 9 | 12 | 15 |
| Tháng 12 | 10 | 8 | 14 | 13 |

Bài tham khảo 1
Introduction
The line graph illustrates the number of blog posts written by four individuals (Person A, Person B, Person C, and Person D) each month throughout the year 2010. The data is presented in terms of the number of posts per month.
Overview
Overall, Person D consistently wrote the highest number of blog posts each month, while Person B generally had the fewest posts. Despite some fluctuations, the number of posts for each person did not show significant trends of increase or decrease over the year.
Body 1
At the beginning of the year in January, Person D led with 15 posts, followed by Person C with 12, Person A with 10, and Person B with 8. Over the next few months, the numbers remained relatively stable, with minor fluctuations. In April, Person A peaked at 14 posts, while Person D’s posts decreased gradually to 12 by May. Similarly, Person C’s posts varied, peaking at 15 in March before slightly declining.
Body 2
From June to December, the trend continued with some variations. Person D’s number of posts ranged from 11 to 15, maintaining a leading position in most months. Person A and Person C’s posts also saw slight increases and decreases, with Person A peaking at 14 again in September and Person C maintaining a relatively steady number of posts, peaking at 15 in September. Person B’s posts remained the lowest overall, with numbers ranging between 7 and 12 posts throughout the year. The year ended with Person D posting 13 times, Person C with 14, Person A with 10, and Person B with 8 posts.
In summary, while there were minor fluctuations in the number of blog posts by each individual, the overall pattern of posting frequency remained consistent throughout the year, with Person D consistently leading in the number of posts and Person B writing the fewest.
Bài tham khảo 2
The line graph illustrates the monthly number of blog posts written by four different individuals (A, B, C, and D) in 2010. The data is representative and spans from January to December.
Overall, Person D consistently posted the most blogs each month, while Person B generally posted the least. The number of posts varied throughout the year, with some fluctuations for each individual.
In the first half of the year, Person A’s blog posts showed some variation, starting with 10 posts in January, dropping to 9 in February, and peaking at 14 in April. Person B’s posts were relatively stable, fluctuating between 7 and 12 posts, with the highest number in May. Person C’s numbers ranged from 10 to 15 posts, while Person D started strong with 15 posts in January, decreased to 12 in April, and rose again to 14 in June.
In the second half of the year, Person A had consistent numbers, posting between 10 and 14 blogs monthly. Person B’s activity was similar, ranging from 8 to 12 posts. Person C maintained a steady number of posts, fluctuating between 12 and 15. Person D continued to lead with posts ranging from 12 to 15, reaching the peak in November and January.
In conclusion, Person D was the most active blogger throughout the year, while Person B was the least active. The data shows that all four individuals had varying levels of blogging activity, with some months being more productive than others.
Bài tham khảo 3
Introduction
The line graph illustrates the number of blog posts written each month in 2010 by four individuals: Person A, Person B, Person C, and Person D.
Overview
Overall, Person D consistently had the highest number of blog posts, while Person B generally had the lowest. The figures for each person fluctuated throughout the year, showing some noticeable trends and variations.
Body 1
In January, Person D led with 15 posts, followed by Person C with 12, Person A with 10, and Person B with 8. Throughout the first half of the year, Person D’s output showed a decline, hitting a low of 11 posts in May. Conversely, Person A and Person C saw a gradual increase during this period, with Person A peaking at 14 posts in April, and Person C reaching their highest count of 15 posts in March and September.
Body 2
In the second half of the year, Person B experienced a significant increase, peaking at 12 posts in May and October. Person D’s output increased again, reaching 15 posts in July and November. Person A’s posts fluctuated, with a notable high of 14 posts in September. Person C maintained a relatively stable output, with minor fluctuations and ending the year with 14 posts in December.
Conclusion
To summarize, each person showed unique patterns in their blogging activity, with Person D consistently producing the most posts and Person B the least. The variations in monthly blog posts highlight the dynamic nature of their blogging habits throughout 2010.