IELTS Writing Task 1 Line Graph: Biểu đồ đường minh họa lượng tiêu thụ nước uống đóng chai hàng tháng của bốn công ty trong năm 2021. Cụ thể, biểu đồ so sánh sự thay đổi trong mức tiêu thụ của từng công ty, cho thấy các xu hướng tiêu thụ khác nhau và các điểm cao nhất, thấp nhất trong suốt năm.
Bạn có thể đọc lại bài nói về Task 1 tại đây: IELTS Writing Task 1 cần lưu ý những gì?
Bạn cũng có thể đọc thêm bài viết này vì đề bài này là IELTS Writing Task 1 biểu đồ Line Graph.
IELTS Writing Task 1 Line Graph: Bottled Water
You should spent about 20 mintutes on this task
The line graph illustrates the monthly consumption of bottled water by four companies in 2021. Specifically, the graph compares the changes in consumption for each company, showing different consumption trends and the highest and lowest points throughout the year.
You should write at least 150 words.

Bài tham khảo 1
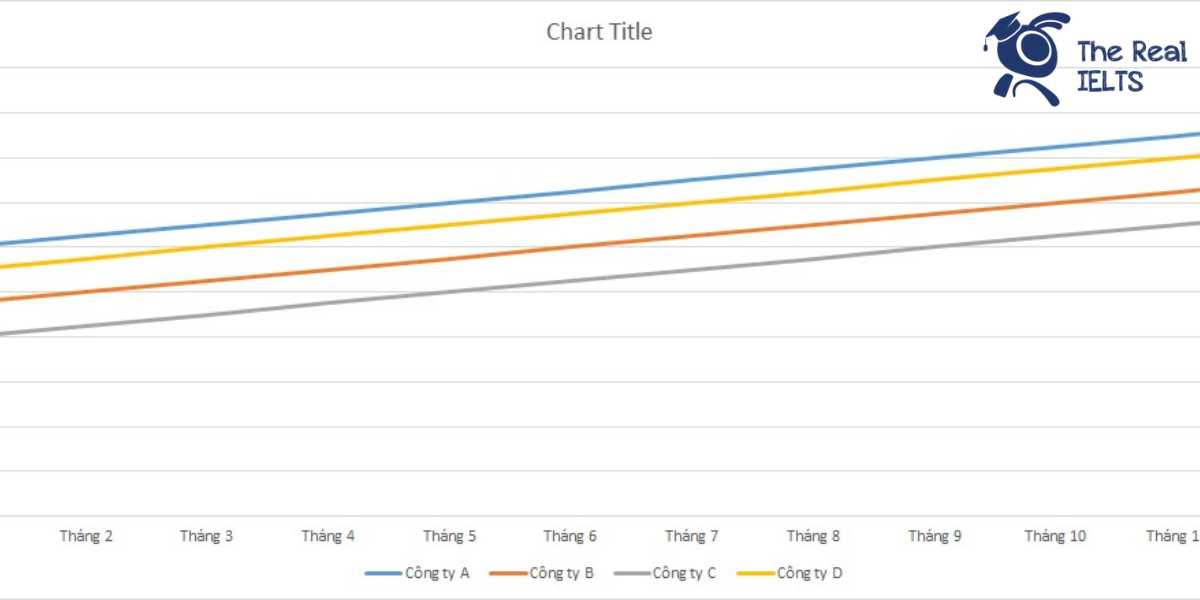
The line graph illustrates the monthly consumption of bottled water by four companies (A, B, C, D) over the year 2021. The units are measured in millions of liters.
Overall, the consumption of bottled water showed a steady increase for all four companies throughout the year. Company A consistently led in consumption, followed by companies C, D, and B.
In the first half of the year, Company A started with 1.2 million liters in January and increased by 0.1 million liters each month, reaching 1.7 million liters in June. Company B had the lowest consumption initially at 0.8 million liters, but it also showed a steady monthly increase, reaching 1.3 million liters by June. Companies C and D followed a similar trend, with Company C starting at 1.0 million liters and Company D at 0.9 million liters in January. By June, their consumption rose to 1.5 million liters and 1.4 million liters, respectively.
In the latter half of the year, the upward trend continued for all companies. Company A’s consumption rose from 1.8 million liters in July to 2.3 million liters in December, maintaining its lead. Company B’s consumption increased from 1.4 million liters in July to 1.9 million liters by year-end, remaining the lowest among the four. Company C’s consumption went from 1.6 million liters in July to 2.1 million liters in December, while Company D saw its consumption grow from 1.5 million liters to 2.0 million liters during the same period.
In conclusion, while all companies experienced a continuous rise in bottled water consumption throughout 2021, Company A consistently had the highest consumption, followed by Companies C, D, and B.
Bài tham khảo 2
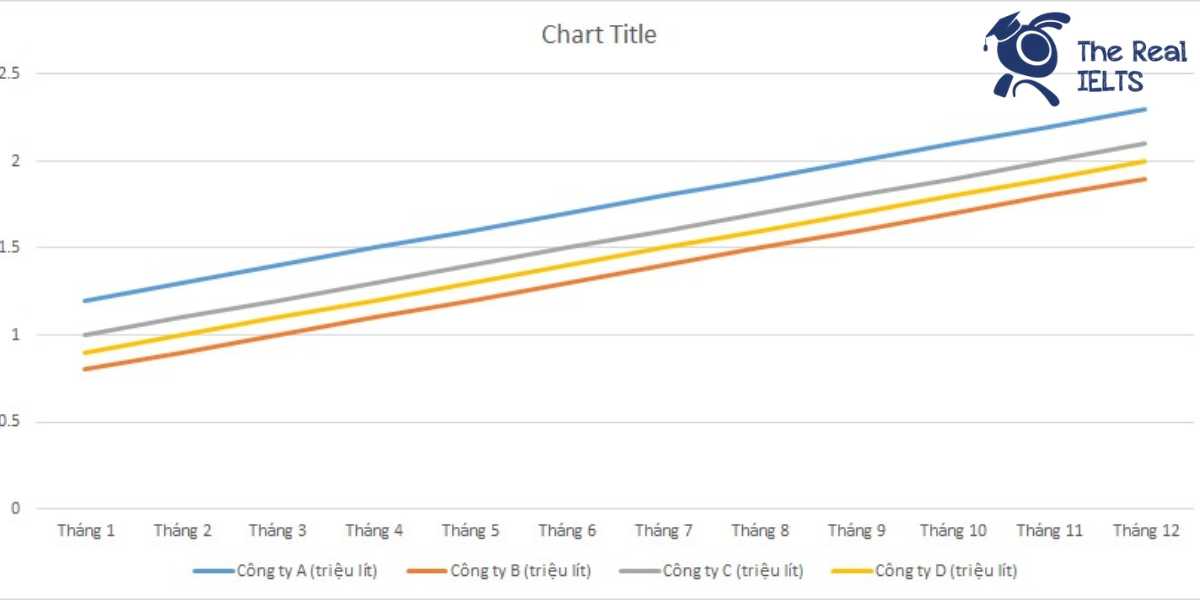
The line graph illustrates the monthly consumption of bottled water by four companies (A, B, C, D) in 2021. The data is measured in millions of liters.
Overall, it is evident that all four companies experienced a steady increase in bottled water consumption throughout the year. Company A consistently had the highest consumption each month, while Company B had the lowest.
In the first half of the year, Company A’s consumption rose from 1.2 million liters in January to 1.7 million liters in June. Similarly, Company B’s consumption increased from 0.8 million liters to 1.3 million liters over the same period. Company C and Company D showed a similar upward trend, with Company C’s figures climbing from 1.0 million liters to 1.5 million liters, and Company D’s from 0.9 million liters to 1.4 million liters.
During the second half of the year, the upward trend continued. By December, Company A’s consumption reached 2.3 million liters, while Company B’s consumption rose to 1.9 million liters. Company C and Company D’s consumption also continued to grow, with Company C reaching 2.1 million liters and Company D hitting 2.0 million liters in December.
In summary, all four companies saw a consistent increase in bottled water consumption throughout 2021, with Company A maintaining the highest consumption and Company B the lowest.
Bài tham khảo 3
The line graph illustrates the monthly consumption of bottled water by four companies (A, B, C, D) over the year 2021. The figures are presented in million liters.
Overall, all four companies experienced a consistent increase in their bottled water consumption throughout the year. Company A had the highest consumption each month, while Company B consistently showed the lowest figures among the four.
In the first half of 2021, Company A’s consumption began at 1.2 million liters in January and steadily increased by 0.1 million liters each month, reaching 1.7 million liters in June. Similarly, Company B started at 0.8 million liters in January and also grew by 0.1 million liters monthly, totaling 1.3 million liters by June. Companies C and D followed the same upward trend, with Company C increasing from 1.0 to 1.5 million liters and Company D from 0.9 to 1.4 million liters during this period.
In the second half of the year, Company A continued to lead with its consumption rising from 1.8 million liters in July to 2.3 million liters in December. Company B’s figures grew from 1.4 million liters to 1.9 million liters in the same period. Company C’s consumption increased from 1.6 million liters in July to 2.1 million liters by December, while Company D’s figures went up from 1.5 million liters to 2.0 million liters.
In summary, all four companies demonstrated a steady increase in bottled water consumption throughout 2021, with Company A consistently having the highest monthly consumption and Company B the lowest.