IELTS Writing Task 1 yêu cầu thí sinh phân tích và mô tả các dữ liệu thống kê. Năm 2011, 4 cửa hàng máy tính ghi nhận số lượng bán hàng tháng khác nhau. Bằng cách sử dụng các biểu đồ, thí sinh phải mô tả sự khác biệt này, với mục đích là phân tích xu hướng và đưa ra các nhận xét có cơ sở về sự thay đổi trong doanh số bán hàng của từng cửa hàng qua các tháng trong năm.
Bạn có thể đọc lại bài nói về Task 1 tại đây: IELTS Writing Task 1 cần lưu ý những gì?
Bạn cũng có thể đọc thêm bài viết này vì đề bài này là IELTS Writing Task 1 biểu đồ Line Graph.
Bạn cũng có thể Xây Dựng Lộ Trình Cá Nhân Hóa của mình tại link.
IELTS Writing Task 1 Line Graph: Computer
You should spent about 20 mintutes on this task
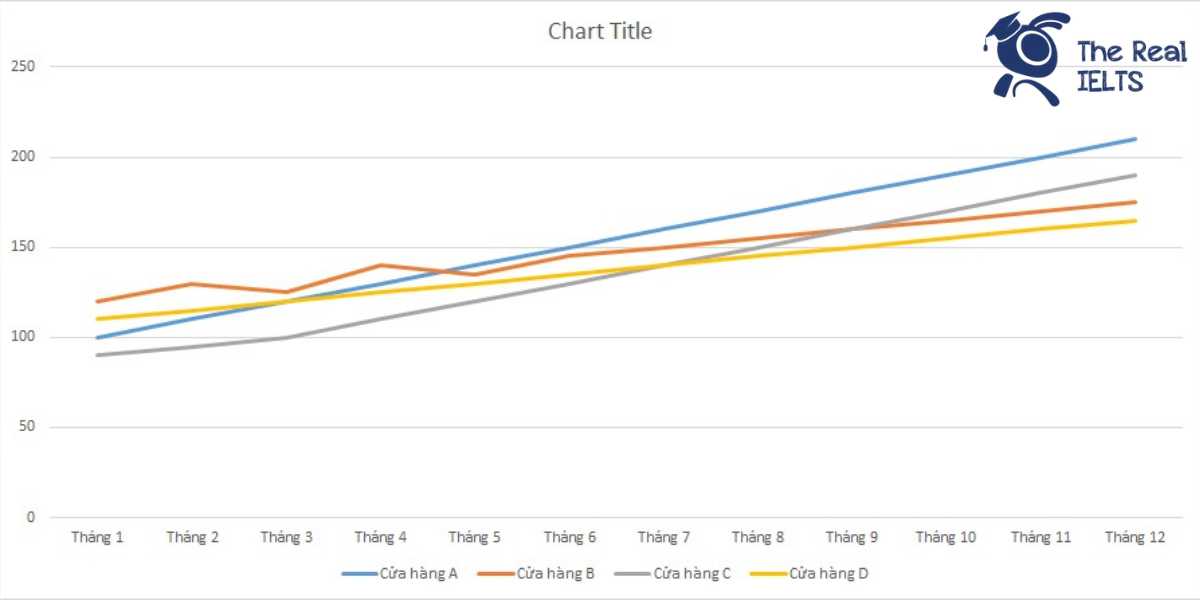
IELTS Writing Task 1 requires candidates to analyze and describe statistical data. In 2011, four different computer stores recorded varying monthly sales figures. Using charts, candidates must illustrate these differences, aiming to analyze trends and provide informed observations on changes in sales volumes for each store across the months of the year.
You should write at least 150 words.
| Tháng | Cửa hàng A | Cửa hàng B | Cửa hàng C | Cửa hàng D |
| Tháng 1 | 100 | 120 | 90 | 110 |
| Tháng 2 | 110 | 130 | 95 | 115 |
| Tháng 3 | 120 | 125 | 100 | 120 |
| Tháng 4 | 130 | 140 | 110 | 125 |
| Tháng 5 | 140 | 135 | 120 | 130 |
| Tháng 6 | 150 | 145 | 130 | 135 |
| Tháng 7 | 160 | 150 | 140 | 140 |
| Tháng 8 | 170 | 155 | 150 | 145 |
| Tháng 9 | 180 | 160 | 160 | 150 |
| Tháng 10 | 190 | 165 | 170 | 155 |
| Tháng 11 | 200 | 170 | 180 | 160 |
| Tháng 12 | 210 | 175 | 190 | 165 |

Bài tham khảo 1
Introduction
The table illustrates the monthly computer sales in 2011 for four different computer stores: Store A, Store B, Store C, and Store D. The data provides insight into the sales trends and allows for a comparative analysis between these stores throughout the year.
Overview
Overall, all four stores showed a consistent increase in computer sales over the year. Store A consistently had the highest sales each month, while Store C had the lowest sales initially but saw significant growth by the end of the year. Store B and Store D also experienced steady increases, with Store B generally outperforming Store D.
Body 1
At the beginning of the year, in January, Store A sold 100 computers, which was lower than Store B’s 120 but higher than Store C and Store D, which sold 90 and 110 computers respectively. Store A’s sales increased steadily each month, reaching 210 computers in December, marking the highest sales figure among the four stores. Similarly, Store B started with 120 computers in January and saw an increase to 175 computers by December, maintaining a strong performance throughout the year.
Body 2
Store C started with the lowest sales at 90 computers in January but showed significant growth over the months, reaching 190 computers by December. This remarkable increase allowed Store C to nearly close the gap with Store A. Store D, on the other hand, had a more modest increase from 110 computers in January to 165 computers in December. While Store D showed steady growth, it consistently had the lowest sales among the four stores in the latter half of the year.
In conclusion, Store A led in sales consistently, followed by Store B. Store C showed the most significant improvement, while Store D, despite steady growth, had the lowest sales in the second half of the year.
Bài tham khảo 2
Introduction
The table provides data on the monthly computer sales in 2011 for four different computer stores: Store A, Store B, Store C, and Store D. The table covers the entire year, from January to December, highlighting the number of computers sold each month by each store.
Overview
Overall, the sales figures for all four stores showed an upward trend throughout the year. Store A consistently had the highest sales each month, while Store C had the lowest sales at the beginning of the year but improved significantly by the end. Store D maintained a steady increase, whereas Store B’s sales, while increasing, showed the least variability.
Body 1
In the first half of the year, Store A started with 100 units sold in January and increased its sales each month, reaching 150 units in June. Store B, which began with higher sales at 120 units in January, also showed a consistent increase, ending with 145 units in June. Store C’s sales followed a similar trend, starting at 90 units and increasing to 130 units by June. Store D’s sales began at 110 units and rose steadily to 135 units in June.
Body 2
In the second half of the year, the trend of increasing sales continued for all stores. Store A’s sales peaked at 210 units in December. Store B also saw growth, reaching 175 units in December. Store C experienced the most significant growth, from 140 units in July to 190 units in December, showing substantial improvement compared to the first half of the year. Store D maintained a more modest increase, ending the year with 165 units sold in December.
In summary, while all stores exhibited growth in computer sales throughout 2011, Store A consistently outperformed the others, and Store C showed the most remarkable improvement over the year.
Bài tham khảo 3
Introduction
The table provides monthly sales data for computers from four different stores (A, B, C, and D) throughout the year 2011. The figures are measured in units sold per month.
Overview
Overall, the sales of computers in all four stores showed an upward trend over the course of the year. Store A consistently had the highest sales, while Store C started with the lowest sales but saw significant growth by the end of the year. Store B and Store D also experienced steady increases in their sales figures.
Body 1
At the beginning of the year, Store A sold 100 computers in January, which was the lowest monthly figure for this store. However, its sales increased steadily each month, reaching 210 units in December, the highest sales figure among all stores. Store B started with 120 units sold in January and also showed a steady rise in sales, culminating in 175 units sold in December.
Body 2
Store C, which had the lowest initial sales of 90 units in January, showed substantial growth, ending the year with 190 units sold in December. Store D’s sales pattern was similar to that of Store B, starting with 110 units in January and increasing to 165 units by December. Despite some fluctuations, all stores demonstrated a positive growth trajectory throughout the year, with the most notable increases observed in Store A and Store C.
Bài tham khảo 4
Introduction
The table illustrates the monthly sales of computers in the year 2011 from four different computer stores: Store A, Store B, Store C, and Store D. The data provided allows for a comparative analysis of the sales performance of these stores throughout the year.
Overview
Overall, Store A consistently achieved the highest monthly sales, while Store C started with the lowest sales but saw a significant increase over the year. All stores showed a general upward trend in their sales figures, with varying degrees of growth.
Body 1
In January, Store B led with 120 units sold, followed by Store D with 110 units, Store A with 100 units, and Store C with 90 units. By June, Store A had overtaken the others with 150 units, closely followed by Store B at 145 units, Store C at 130 units, and Store D at 135 units. The mid-year period showed a steady increase in sales for all stores, with Store A showing the most significant growth.
Body 2
Towards the end of the year, Store A maintained its lead, reaching a peak of 210 units in December. Store B also saw substantial growth, ending the year with 175 units. Store C and Store D, while starting lower, ended with strong figures of 190 and 165 units, respectively. The data highlights that Store A had the most consistent and highest sales growth, while Store C demonstrated the most significant improvement from the beginning to the end of the year.
In conclusion, while all four stores experienced growth in computer sales over the year, Store A was the top performer, and Store C showed the greatest improvement in sales.