IELTS Writing Task 1 yêu cầu mô tả biểu đồ tỷ lệ tội phạm hàng tháng năm 2010 của bốn thành phố. Thí sinh cần phân tích số liệu, so sánh xu hướng và nêu bật những thay đổi quan trọng. Kỹ năng biểu đạt chính xác, sử dụng từ vựng phù hợp và cấu trúc câu rõ ràng là yếu tố quan trọng để đạt điểm cao.
Bạn có thể đọc lại bài nói về Task 1 tại đây: IELTS Writing Task 1 cần lưu ý những gì?
Bạn cũng có thể đọc thêm bài viết này vì đề bài này là IELTS Writing Task 1 biểu đồ Line Graph.
Bạn cũng có thể Xây Dựng Lộ Trình Cá Nhân Hóa của mình tại link.
IELTS Writing Task 1 Line Graph: Crime Rates
You should spent about 20 mintutes on this task
IELTS Writing Task 1 requires describing the chart of monthly crime rates in 2010 for four cities. Candidates need to analyze the data, compare trends, and highlight significant changes. Accurate expression, appropriate vocabulary usage, and clear sentence structure are crucial factors to achieve a high score.
You should write at least 150 words.
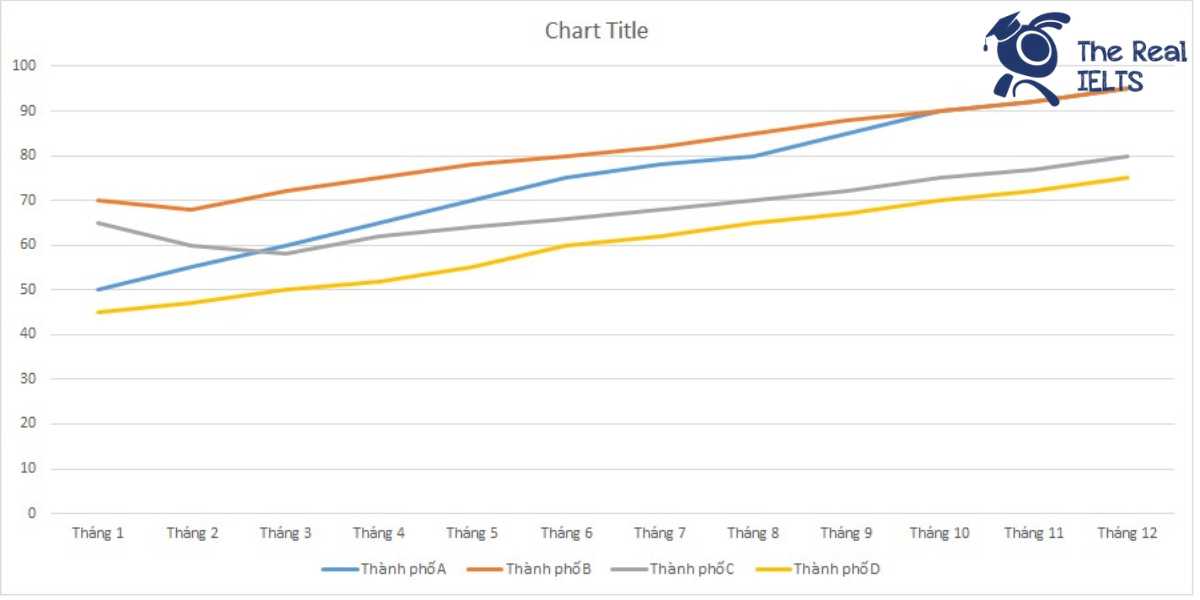
| Tháng | Thành phố A | Thành phố B | Thành phố C | Thành phố D |
| Tháng 1 | 50 | 70 | 65 | 45 |
| Tháng 2 | 55 | 68 | 60 | 47 |
| Tháng 3 | 60 | 72 | 58 | 50 |
| Tháng 4 | 65 | 75 | 62 | 52 |
| Tháng 5 | 70 | 78 | 64 | 55 |
| Tháng 6 | 75 | 80 | 66 | 60 |
| Tháng 7 | 78 | 82 | 68 | 62 |
| Tháng 8 | 80 | 85 | 70 | 65 |
| Tháng 9 | 85 | 88 | 72 | 67 |
| Tháng 10 | 90 | 90 | 75 | 70 |
| Tháng 11 | 92 | 92 | 77 | 72 |
| Tháng 12 | 95 | 95 | 80 | 75 |

Bài tham khảo 1
Introduction
The table illustrates the monthly crime rates for the year 2010 in four cities: City A, City B, City C, and City D. Each row in the table represents a different month, while each column corresponds to one of the cities. This analysis will highlight the overall trends, significant increases or decreases, and notable differences among the cities.
Overview
Overall, all four cities experienced an increase in crime rates over the year. City A and City B had consistently higher crime rates, while City C and City D had relatively lower but still rising figures. The most noticeable trend is the steady rise in crime rates from January to December across all cities.
Body 1
In the first half of the year, City A started with a crime rate of 50 in January and saw a gradual increase to 75 by June. City B had higher initial figures, starting at 70 in January and reaching 80 by June. City C and City D had similar trends but at lower levels, starting at 65 and 45 in January, and rising to 66 and 60 in June, respectively. This period shows that City B consistently had the highest crime rates, while City D had the lowest.
Body 2
In the second half of the year, the crime rates continued to climb in all cities. City A’s crime rate rose to 95 by December, showing a consistent increase each month. Similarly, City B’s rate increased to 95, indicating a parallel trend with City A. City C’s crime rate also rose steadily, reaching 80 by December. City D, although having the lowest rates overall, also experienced a rise, ending the year with a rate of 75. Notably, City B and City A had identical crime rates by the end of the year, while City D remained the city with the least crime throughout 2010.
In conclusion, the table data indicates a clear upward trend in crime rates across all four cities throughout 2010, with City B and City A having the highest rates and City D the lowest.
Bài tham khảo 2
Introduction
The table presents the monthly crime rates in four cities—City A, City B, City C, and City D—throughout the year 2010. The data illustrates the fluctuations in crime rates for each city over the twelve months.
Overview
Overall, the crime rates in all four cities show an increasing trend from January to December. City A consistently has the lowest crime rates, while City B has the highest. City C and City D have moderate crime rates, with City C slightly higher than City D throughout the year.
Body 1
City A starts with the lowest crime rate of 50 in January and steadily increases to 95 by December. Similarly, City B, which begins with a high rate of 70 in January, reaches its peak at 95 in December, reflecting the highest crime rate among the four cities each month. City C follows a more moderate upward trend, starting at 65 in January and ending at 80 in December.
Body 2
City D shows the lowest overall crime rates among the four cities, starting at 45 in January and reaching 75 by December. Despite the increasing trend, City D’s crime rates remain consistently lower than those of the other cities. Notably, City B has a sharper increase compared to the other cities, particularly from January to August, where the crime rate rises from 70 to 85, indicating a significant rise in crime activity.
In conclusion, while all four cities experienced an increase in crime rates throughout 2010, City B had the highest rates, and City D had the lowest, with City A and City C showing intermediate figures.
Bài tham khảo 3
The table illustrates the monthly crime rates in four cities (A, B, C, and D) throughout the year 2010.
Overall, it is evident that crime rates in all four cities experienced a general upward trend over the year. City A and City B showed the most significant increases, while City D had the lowest crime rates each month compared to the other cities.
In the first half of the year, City A’s crime rates increased steadily from 50 in January to 75 in June. Similarly, City B started at a higher rate of 70 in January and rose to 80 by June. City C’s crime rates showed a slight decrease from 65 in January to 58 in March, before gradually climbing back up to 66 in June. City D maintained the lowest crime rates, rising from 45 in January to 60 in June.
In the latter half of the year, the upward trend continued for all cities. City A’s crime rates rose from 78 in July to 95 in December, showing the highest increase among the four cities. City B also followed a similar pattern, increasing from 82 in July to 95 in December. City C’s crime rates went up from 68 in July to 80 in December, while City D’s rates increased from 62 in July to 75 in December.
In summary, all four cities experienced an increase in crime rates over the year, with City A and City B showing the most significant rises, and City D maintaining the lowest rates throughout the year.
Bài tham khảo 4
Introduction
The table illustrates the monthly crime rates in four cities (City A, City B, City C, and City D) throughout the year 2010. Each row represents a month, and each column corresponds to a city, showing the number of crimes recorded.
Overview
Overall, City A and City B experienced a steady increase in crime rates from January to December, with City B consistently having higher rates than City A. City C and City D also saw an upward trend, although the increases were less pronounced compared to City A and City B. Notably, City D had the lowest crime rates at the beginning of the year but saw significant growth by December.
Body 1
City A started with a crime rate of 50 in January and saw a gradual increase, peaking at 95 in December. This consistent rise is mirrored in City B, which began with a higher initial rate of 70 in January and also reached 95 by December. This pattern suggests a parallel trend in both cities, with City B maintaining a slightly higher rate until the end of the year.
Body 2
In contrast, City C and City D had lower starting points in January, with rates of 65 and 45, respectively. Despite the lower initial rates, both cities experienced an upward trend. City C’s rate increased steadily from 65 to 80, while City D saw a significant rise from 45 to 75. By December, City C had the third highest rate, whereas City D, despite its initial low rate, showed the most significant relative increase among the four cities.
In summary, the data reveals that all four cities experienced rising crime rates throughout 2010, with City B leading in the highest rates and City D having the most notable increase from its initial position.