IELTS Writing Task 1 yêu cầu mô tả biểu đồ đường biểu thị nhiệt độ trong ngày của các thành phố lớn. Bài viết cần nêu rõ sự biến đổi nhiệt độ theo thời gian, so sánh sự khác biệt giữa các thành phố và phân tích xu hướng chung, sử dụng số liệu chính xác và từ vựng mô tả phù hợp.
Bạn có thể đọc lại bài nói về Task 1 tại đây: IELTS Writing Task 1 cần lưu ý những gì?
Bạn cũng có thể đọc thêm bài viết này vì đề bài này là IELTS Writing Task 1 biểu đồ Line Graph.
IELTS Writing Task 1 Line Graph: daily temperature
You should spent about 20 minutes on this task
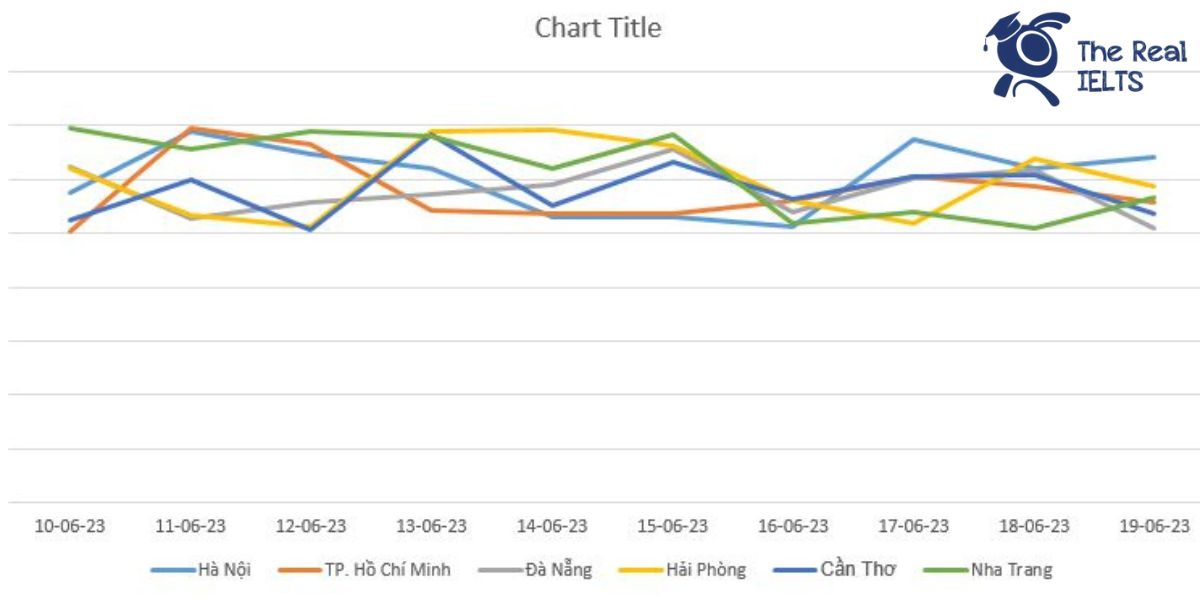
IELTS Writing Task 1 requires describing a line graph showing the daily temperature of major cities. The essay should clearly outline the temperature variations over time, compare the differences between cities, and analyze the overall trends, using accurate data and appropriate descriptive vocabulary.
You should write at least 150 words.
| Ngày | Hà Nội | TP. Hồ Chí Minh | Đà Nẵng | Hải Phòng | Cần Thơ | Nha Trang |
| 10-06-23 | 28.75 | 25.21 | 31.12 | 31.08 | 26.22 | 34.7 |
| 11-06-23 | 34.51 | 34.7 | 26.39 | 26.71 | 29.95 | 32.75 |
| 12-06-23 | 32.32 | 33.32 | 27.92 | 25.65 | 25.34 | 34.39 |
| 13-06-23 | 30.99 | 27.12 | 28.66 | 34.49 | 34.09 | 33.95 |
| 14-06-23 | 26.56 | 26.82 | 29.56 | 34.66 | 27.59 | 30.98 |
| 15-06-23 | 26.56 | 26.83 | 32.85 | 33.08 | 31.63 | 34.22 |
| 16-06-23 | 25.58 | 28.04 | 27 | 28.05 | 28.12 | 25.88 |
| 17-06-23 | 33.66 | 30.25 | 30.14 | 25.98 | 30.2 | 26.96 |
| 18-06-23 | 31.01 | 29.32 | 30.92 | 31.84 | 30.47 | 25.45 |
| 19-06-23 | 32.08 | 27.91 | 25.46 | 29.4 | 26.85 | 28.25 |

Bài Writing tham khảo 1
The line graph illustrates the temperatures in six major cities in Vietnam, namely Hanoi, Ho Chi Minh City, Da Nang, Hai Phong, Can Tho, and Nha Trang, over a ten-day period from June 10 to June 19, 2023.
Overall, the temperatures in these cities showed significant fluctuations throughout the observed period. Notably, Nha Trang experienced the highest temperatures on most days, whereas the temperatures in Hanoi and Ho Chi Minh City were more variable.
In detail, on June 10, the temperatures ranged from 25.21°C in Ho Chi Minh City to 34.70°C in Nha Trang. The following day, temperatures peaked in Hanoi at 34.51°C, while Da Nang dropped to 26.39°C. Over the next few days, temperatures in Hanoi remained relatively high, peaking again at 33.66°C on June 17 before settling at 32.08°C on June 19.
Ho Chi Minh City’s temperature peaked at 34.70°C on June 11 but generally stayed lower than Nha Trang’s, which consistently recorded high temperatures, with a maximum of 34.70°C on June 10 and a slight decrease to 28.25°C by June 19. Da Nang, Hai Phong, and Can Tho showed varying temperatures but generally remained lower than those of Hanoi and Nha Trang. For instance, Da Nang reached its highest temperature of 32.85°C on June 15.
On June 16, a noticeable drop occurred across most cities, with the exception of Hanoi and Nha Trang. By June 19, the temperature in Hai Phong had risen again to 29.40°C, while Can Tho’s temperature peaked at 31.63°C on June 15 before gradually decreasing.
In conclusion, the temperatures across the six cities varied significantly over the ten-day period, with Nha Trang consistently recording the highest temperatures and the others showing considerable fluctuations.
Bài Writing tham khảo 2
The line graph illustrates the temperature fluctuations over a ten-day period from June 10 to June 19, 2023, in six Vietnamese cities: Hanoi, Ho Chi Minh City, Da Nang, Hai Phong, Can Tho, and Nha Trang.
Overall, it is evident that there were significant variations in temperatures across these cities throughout the given period. Notably, Nha Trang experienced the highest temperature while the temperatures in other cities fluctuated within a narrower range.
In the first part of the period, from June 10 to June 15, temperatures in Hanoi showed an upward trend, peaking at 34.51°C on June 11 before fluctuating and eventually dropping to 26.56°C on June 14 and 15. Similarly, Ho Chi Minh City’s temperature peaked at 34.70°C on June 11, followed by a decline, and then fluctuated around the mid-20s to low 30s for the rest of the period.
Da Nang’s temperatures showed a notable decrease from 31.12°C on June 10 to 26.39°C on June 11, followed by fluctuations and reaching a peak of 32.85°C on June 15. Meanwhile, Hai Phong experienced its highest temperature on June 14 at 34.66°C and generally remained in the higher temperature range throughout the period.
In contrast, Can Tho’s temperatures varied more moderately, peaking at 34.09°C on June 13 and generally fluctuating in the high 20s to low 30s. Nha Trang, the hottest city among the six, had its highest temperature on June 10 at 34.70°C, showing notable fluctuations but generally staying above 25°C, with the lowest temperature recorded at 25.45°C on June 18.
In summary, while all cities experienced significant temperature changes, Nha Trang stood out with consistently higher temperatures, and there were noticeable peaks and troughs in each city’s temperature data throughout the observed period.
Bài Writing tham khảo 3
The provided data presents the daily temperatures in six Vietnamese cities over a ten-day period in June 2023.
Overview: Overall, the temperatures fluctuated significantly in all six cities, with each experiencing peaks and troughs throughout the given period. Nha Trang consistently recorded the highest temperatures, while Hanoi, Hồ Chí Minh City, and Đà Nẵng showed more variability. Cần Thơ and Hải Phòng also experienced notable changes but were generally cooler than Nha Trang.
Body 1: From June 10 to June 12, Hanoi’s temperature increased from 28.75°C to a peak of 34.51°C, then dropped slightly to 32.32°C. Similarly, Hồ Chí Minh City saw a rise from 25.21°C to 34.70°C, followed by a minor decrease to 33.32°C. Đà Nẵng had an initial high of 31.12°C, a significant drop to 26.39°C, and then a moderate increase to 27.92°C. Meanwhile, Hải Phòng’s temperature varied minimally around 31°C before dropping to 25.65°C. Cần Thơ showed a more gradual increase, reaching 29.95°C before falling to 25.34°C. Nha Trang consistently stayed above 30°C, peaking at 34.70°C before slightly decreasing.
Body 2: Between June 13 and June 19, temperatures continued to vary. Hanoi’s temperature fluctuated, ending at 32.08°C. Hồ Chí Minh City’s temperature showed a significant drop, stabilizing at around 27°C. Đà Nẵng experienced moderate fluctuations, ending with a low of 25.46°C. Hải Phòng reached a peak of 34.66°C before decreasing to 29.40°C. Cần Thơ experienced a peak of 34.09°C, with a gradual decrease to 26.85°C by June 19. Nha Trang remained relatively high but showed a decreasing trend towards the end, finishing at 28.25°C.
In summary, each city’s temperature trends exhibited unique patterns, with Nha Trang generally being the hottest, while the other cities displayed varied but generally cooler temperatures.