IELTS Writing Task 1 Line Graph: Biểu đồ đường minh họa lượng tiêu thụ năng lượng tái tạo hàng năm của bốn thành phố từ năm 2012 đến 2022. Biểu đồ cho thấy xu hướng tiêu thụ tăng hoặc giảm của từng thành phố trong giai đoạn này, từ đó giúp so sánh và đánh giá mức độ sử dụng năng lượng tái tạo giữa các thành phố.
Bạn có thể đọc lại bài nói về Task 1 tại đây: IELTS Writing Task 1 cần lưu ý những gì?
Bạn cũng có thể đọc thêm bài viết này vì đề bài này là IELTS Writing Task 1 biểu đồ Line Graph.
IELTS Writing Task 1 Line Graph: Renewable Energy
You should spent about 20 mintutes on this task
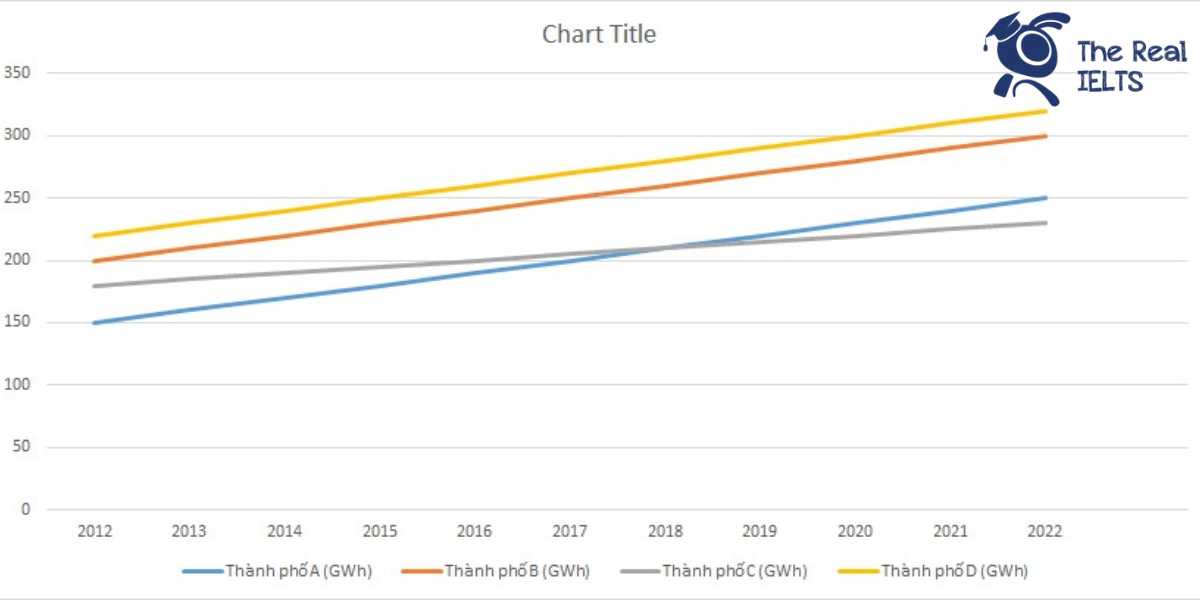
The line graph illustrates the annual consumption of renewable energy by four cities from 2012 to 2022. The graph shows the increasing or decreasing consumption trends of each city during this period, thereby aiding in the comparison and assessment of the level of renewable energy usage among the cities.
You should write at least 150 words.
| Năm | Thành phố A (GWh) | Thành phố B (GWh) | Thành phố C (GWh) | Thành phố D (GWh) |
| 2012 | 150 | 200 | 180 | 220 |
| 2013 | 160 | 210 | 185 | 230 |
| 2014 | 170 | 220 | 190 | 240 |
| 2015 | 180 | 230 | 195 | 250 |
| 2016 | 190 | 240 | 200 | 260 |
| 2017 | 200 | 250 | 205 | 270 |
| 2018 | 210 | 260 | 210 | 280 |
| 2019 | 220 | 270 | 215 | 290 |
| 2020 | 230 | 280 | 220 | 300 |
| 2021 | 240 | 290 | 225 | 310 |
| 2022 | 250 | 300 | 230 | 320 |
Bài tham khảo 1
The line graph illustrates the annual consumption of renewable energy in four cities (A, B, C, and D) from 2012 to 2022. The figures are presented in gigawatt-hours (GWh).
Overall, all four cities experienced a consistent increase in their renewable energy consumption over the given period. City D consistently consumed the most energy, while City A consumed the least.
In 2012, City D led with 220 GWh, followed by City B at 200 GWh, City C at 180 GWh, and City A at 150 GWh. Over the decade, City D saw a steady rise, reaching 320 GWh in 2022. Similarly, City B and City C demonstrated significant increases, with City B climbing to 300 GWh and City C to 230 GWh by 2022.
City A, while having the lowest consumption among the four cities, also showed consistent growth. Starting at 150 GWh in 2012, it increased by 10 GWh each year, reaching 250 GWh by 2022.
In conclusion, all four cities showed a similar upward trend in renewable energy consumption, with City D maintaining the highest usage throughout the period and City A the lowest. This trend reflects a broader shift towards increased reliance on renewable energy sources in these urban areas.
Bài tham khảo 2
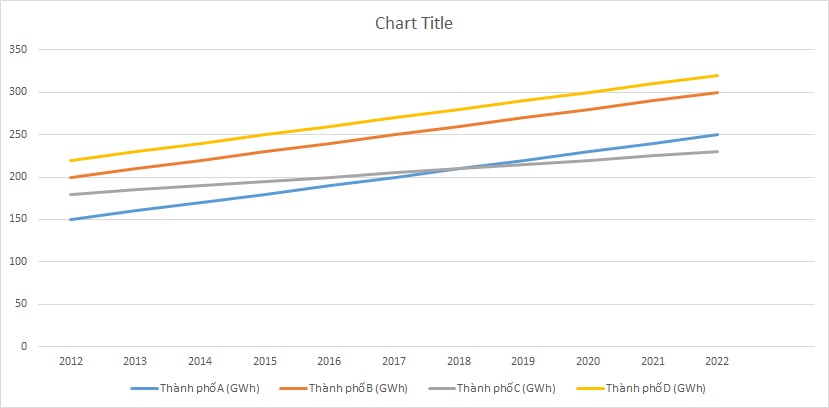
The line graph illustrates the annual consumption of renewable energy in four cities (A, B, C, and D) over a period from 2012 to 2022. The energy consumption is measured in gigawatt-hours (GWh).
Overall, all four cities show a consistent upward trend in the consumption of renewable energy over the given period. City D consistently consumed the most renewable energy each year, while City A had the lowest consumption, although it experienced a steady increase.
In the first half of the period (2012-2017), City D led with the highest consumption, starting at 220 GWh in 2012 and reaching 270 GWh in 2017. This was followed by City B, which began at 200 GWh in 2012 and increased to 250 GWh by 2017. City C and City A also saw gradual increases, with City C starting at 180 GWh and reaching 205 GWh, while City A started at 150 GWh and grew to 200 GWh in the same timeframe.
In the latter half of the period (2018-2022), the trend continued with City D maintaining its lead, reaching 320 GWh in 2022. City B also showed a significant increase, rising to 300 GWh by the end of the period. City C’s consumption grew from 210 GWh in 2018 to 230 GWh in 2022, while City A’s consumption increased from 210 GWh in 2018 to 250 GWh by 2022.
In conclusion, the data indicates a steady increase in renewable energy consumption across all four cities, with City D consistently using the most and City A the least, though both cities, along with B and C, showed similar growth patterns over the ten-year period.
Bài tham khảo 3
The line graph illustrates the annual consumption of renewable energy in four cities (A, B, C, and D) from 2012 to 2022. The data is measured in gigawatt-hours (GWh).
Overall, all four cities experienced a steady increase in renewable energy consumption over the 11-year period. City D consistently had the highest consumption, while City A had the lowest, though both showed significant growth.
In 2012, City D’s renewable energy consumption was the highest at 220 GWh, followed by City B with 200 GWh, City C with 180 GWh, and City A with 150 GWh. Over the next few years, all cities saw a gradual rise in their energy usage. By 2016, City D’s consumption reached 260 GWh, while City B and City C rose to 240 GWh and 200 GWh, respectively. City A, though still the lowest, increased its consumption to 190 GWh.
From 2017 to 2022, the trend of increasing consumption continued. By the end of the period, City D had reached a peak of 320 GWh, maintaining its lead. City B followed closely, reaching 300 GWh. City C’s consumption grew to 230 GWh, while City A, despite being the lowest, still saw a significant rise to 250 GWh.
In conclusion, the data indicates a clear upward trend in renewable energy consumption across all four cities, with City D consistently using the most energy and City A the least, though the gap between them decreased over time.