IELTS Writing Task 1 yêu cầu mô tả biểu đồ lượng xuất khẩu hàng tháng trong năm 2021 của bốn quốc gia. Thí sinh cần phân tích và so sánh số liệu, nêu bật xu hướng chính và sự khác biệt giữa các quốc gia. Bài viết cần rõ ràng, mạch lạc và tuân thủ cấu trúc chuẩn.
Bạn có thể đọc lại bài nói về Task 1 tại đây: IELTS Writing Task 1 cần lưu ý những gì?
Bạn cũng có thể đọc thêm bài viết này vì đề bài này là IELTS Writing Task 1 biểu đồ Line Graph.
Bạn cũng có thể Xây Dựng Lộ Trình Cá Nhân Hóa của mình tại link.
IELTS Writing Task 1 Line Graph: Export Volumes
You should spent about 20 mintutes on this task
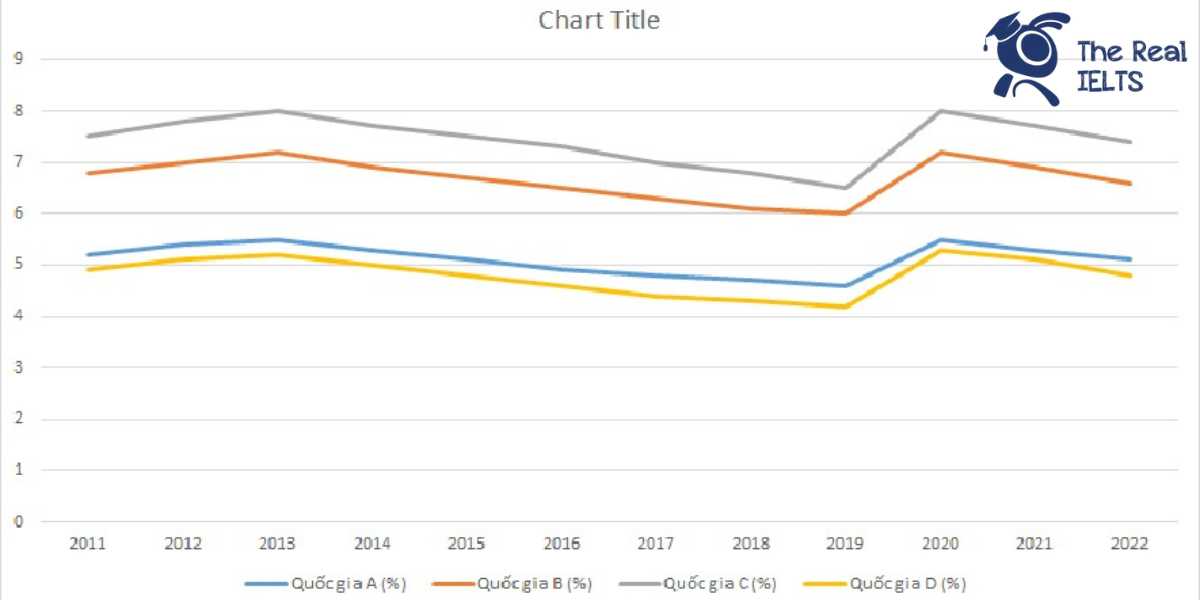
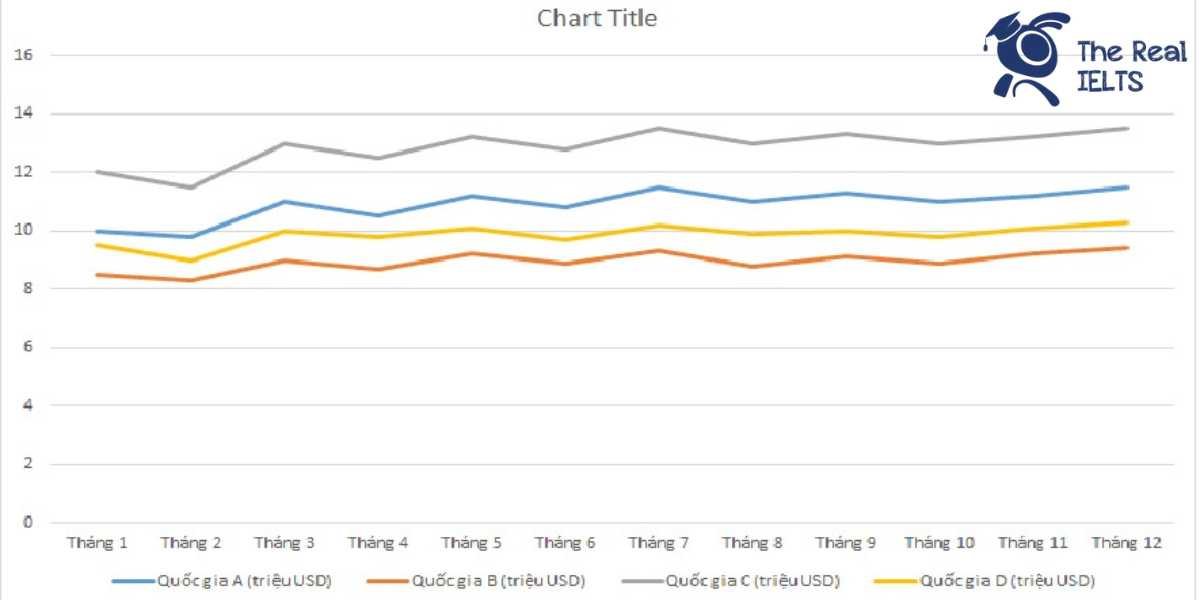
IELTS Writing Task 1 requires describing a chart showing the monthly export volumes in 2021 of four countries. Candidates need to analyze and compare the data, highlighting key trends and differences between the countries. The essay should be clear, coherent, and follow a standard structure.
You should write at least 150 words.
| Tháng | Quốc gia A (triệu USD) | Quốc gia B (triệu USD) | Quốc gia C (triệu USD) | Quốc gia D (triệu USD) |
| Tháng 1 | 10.0 | 8.5 | 12.0 | 9.5 |
| Tháng 2 | 9.8 | 8.3 | 11.5 | 9.0 |
| Tháng 3 | 11.0 | 9.0 | 13.0 | 10.0 |
| Tháng 4 | 10.5 | 8.7 | 12.5 | 9.8 |
| Tháng 5 | 11.2 | 9.2 | 13.2 | 10.1 |
| Tháng 6 | 10.8 | 8.9 | 12.8 | 9.7 |
| Tháng 7 | 11.5 | 9.3 | 13.5 | 10.2 |
| Tháng 8 | 11.0 | 8.8 | 13.0 | 9.9 |
| Tháng 9 | 11.3 | 9.1 | 13.3 | 10.0 |
| Tháng 10 | 11.0 | 8.9 | 13.0 | 9.8 |
| Tháng 11 | 11.2 | 9.2 | 13.2 | 10.1 |
| Tháng 12 | 11.5 | 9.4 | 13.5 | 10.3 |

Bài tham khảo 1
Introduction:
The table provides monthly export values for four countries—A, B, C, and D—over the year 2021, measured in million USD.
Overview:
Overall, Country C consistently had the highest export values throughout the year, whereas Country B recorded the lowest figures. Despite some fluctuations, the export values for all countries showed a general trend of stability with slight increases towards the year’s end.
Body 1:
Country A’s export values started at 10.0 million USD in January, dipped slightly to 9.8 million USD in February, but generally trended upwards, peaking at 11.5 million USD in July and December. Similarly, Country B’s export values were the lowest among the four, starting at 8.5 million USD in January, and fluctuating between 8.3 million USD and 9.4 million USD throughout the year.
Body 2:
Country C consistently led in exports, starting at 12.0 million USD in January and peaking at 13.5 million USD in July and December. Its exports were the highest in each month, showcasing stability and growth. Country D’s exports, starting at 9.5 million USD in January, showed a steady increase, reaching 10.3 million USD in December, closely following the trends observed in Country A.
In conclusion, while Country C maintained its leading position in exports throughout the year, the other countries showed minor fluctuations with an overall slight upward trend in their export values.
Bài tham khảo 2
Introduction:
The table provides a monthly breakdown of export values in million USD for four countries (A, B, C, and D) throughout the year 2021.
Overview:
Overall, Country C consistently had the highest export values each month, while Country B had the lowest. Countries A and D had relatively stable export figures, with slight fluctuations.
Body 1:
Country A’s export values ranged between 9.8 million USD in February to a peak of 11.5 million USD in July and December. The export figures showed a generally upward trend with minor fluctuations. Similarly, Country B’s exports fluctuated between 8.3 million USD in February and 9.4 million USD in December. Despite being the lowest among the four countries, Country B’s exports exhibited a steady increase towards the end of the year.
Body 2:
Country C consistently had the highest export values, starting at 12.0 million USD in January and peaking at 13.5 million USD in July and December. The export values for Country C showed a consistent upward trend with minor monthly variations. Country D’s exports fluctuated more compared to Country A and Country B, ranging from 9.0 million USD in February to 10.3 million USD in December. Despite these fluctuations, Country D’s export values demonstrated a gradual increase over the year.
In summary, while all four countries showed some variation in their monthly export values, Country C consistently led in export figures, and Country B trailed behind the others throughout 2021.
Bài tham khảo 3
Introduction
The table illustrates the monthly export values (in million USD) for four countries (A, B, C, and D) throughout the year 2021.
Overview
Overall, Country C consistently recorded the highest export values each month, while Country B had the lowest figures. Notably, all countries exhibited some fluctuations in their export values, with certain months showing marked increases or decreases.
Body 1
Country A’s export values showed a general upward trend over the year, starting at $10.0 million in January and ending at $11.5 million in December. The highest export value was in July and December at $11.5 million, while the lowest was in February at $9.8 million.
Country B, on the other hand, had the lowest export values throughout the year. Its exports started at $8.5 million in January, slightly fluctuated during the year, and ended at $9.4 million in December. The peak was in July at $9.3 million.
Body 2
Country C consistently had the highest export values among the four countries, beginning at $12.0 million in January and increasing to $13.5 million by December. The exports peaked in July and December at $13.5 million.
Country D’s exports also showed an increasing trend, starting at $9.5 million in January and reaching $10.3 million in December. The highest value was observed in December, while the lowest was in February at $9.0 million.
Overall, Country C led the exports each month, and Country B remained at the bottom, with all countries showing some level of fluctuation throughout the year.
Bài tham khảo 4
Introduction
The table presents the monthly export volumes (in million USD) for four countries (Country A, Country B, Country C, and Country D) throughout the year 2021.
Overview
Overall, Country C consistently had the highest export volumes each month, while Country B had the lowest. The export volumes of all four countries showed some fluctuations throughout the year, but the general trend was relatively stable.
Body 1
In January, Country C led with 12.0 million USD in exports, followed by Country A with 10.0 million USD, Country D with 9.5 million USD, and Country B with 8.5 million USD. February saw a slight decrease for all countries, with Country C dropping to 11.5 million USD, Country A to 9.8 million USD, Country D to 9.0 million USD, and Country B to 8.3 million USD. By March, all countries experienced an increase, with Country C reaching 13.0 million USD, Country A 11.0 million USD, Country D 10.0 million USD, and Country B 9.0 million USD.
Body 2
Throughout the remaining months, the export volumes for each country continued to exhibit minor variations. Country C’s exports ranged from 12.5 million USD in April to a peak of 13.5 million USD in July and December. Country A’s exports ranged from 10.5 million USD in April to 11.5 million USD in July and December. Country D’s exports fluctuated between 9.7 million USD in June to 10.3 million USD in December. Country B’s exports remained the lowest but saw gradual increases, from 8.7 million USD in April to 9.4 million USD in December. Despite these fluctuations, each country maintained a relatively consistent export performance throughout 2021.
Bài tham khảo 5
Introduction
The table provides monthly data on export values, in millions of USD, for four countries (A, B, C, and D) throughout 2021.
Overview
Overall, Country C consistently achieved the highest export values each month, while Country B had the lowest. Country A and Country D showed moderate and relatively stable export figures, with slight fluctuations throughout the year.
Body 1
Country C led the exports across all months, starting with $12.0 million in January and peaking at $13.5 million in both July and December. This country consistently maintained higher export figures compared to the others. Country A followed, with its exports ranging from $9.8 million in February to $11.5 million in July and December. There was a slight drop in February, but otherwise, exports remained relatively stable.
Body 2
Country B recorded the lowest export values, beginning at $8.5 million in January and showing slight variations, ending at $9.4 million in December. Despite these fluctuations, the figures remained under $10 million throughout the year. Country D’s exports were higher than Country B’s but lower than the others, fluctuating between $9.0 million in February and $10.3 million in December, indicating a modest but steady increase over the months.