IELTS Writing Task 1 yêu cầu thí sinh mô tả và phân tích biểu đồ thể hiện số lượng bài viết trên các diễn đàn hàng tháng của bốn thành phố trong năm 2021. Thí sinh cần so sánh số liệu giữa các thành phố, nhận xét xu hướng và sự biến động theo thời gian để viết một báo cáo chính xác và logic.
Bạn có thể đọc lại bài nói về Task 1 tại đây: IELTS Writing Task 1 cần lưu ý những gì?
Bạn cũng có thể đọc thêm bài viết này vì đề bài này là IELTS Writing Task 1 biểu đồ Line Graph.
IELTS Writing Task 1 Line Graph: Forum Posts
You should spent about 20 mintutes on this task
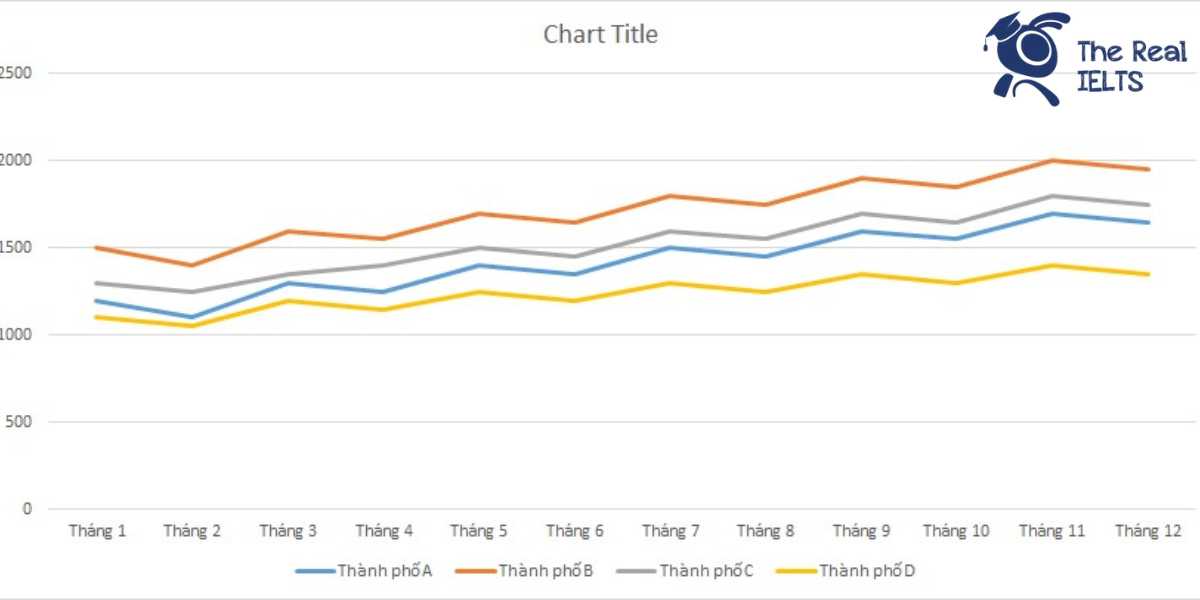
IELTS Writing Task 1 requires candidates to describe and analyze a chart showing the number of posts on forums per month for four cities in 2021. Candidates need to compare the figures between the cities, comment on trends and fluctuations over time, and write an accurate and logical report.
You should write at least 150 words.
| Tháng | Thành phố A | Thành phố B | Thành phố C | Thành phố D |
| Tháng 1 | 1200 | 1500 | 1300 | 1100 |
| Tháng 2 | 1100 | 1400 | 1250 | 1050 |
| Tháng 3 | 1300 | 1600 | 1350 | 1200 |
| Tháng 4 | 1250 | 1550 | 1400 | 1150 |
| Tháng 5 | 1400 | 1700 | 1500 | 1250 |
| Tháng 6 | 1350 | 1650 | 1450 | 1200 |
| Tháng 7 | 1500 | 1800 | 1600 | 1300 |
| Tháng 8 | 1450 | 1750 | 1550 | 1250 |
| Tháng 9 | 1600 | 1900 | 1700 | 1350 |
| Tháng 10 | 1550 | 1850 | 1650 | 1300 |
| Tháng 11 | 1700 | 2000 | 1800 | 1400 |
| Tháng 12 | 1650 | 1950 | 1750 | 1350 |

Bài tham khảo 1
Introduction
The line graph illustrates the monthly number of forum posts in four cities (A, B, C, and D) over the year 2021.
Overview
Overall, all four cities showed a general upward trend in the number of forum posts throughout the year. City B consistently had the highest number of posts each month, while City D had the lowest. Notable fluctuations can be observed in the data, particularly towards the latter part of the year.
Body 1
In January, City B led with 1500 posts, followed by City C with 1300 posts, City A with 1200, and City D with 1100. City B maintained its top position throughout the year, reaching its peak at 2000 posts in November. Meanwhile, City C and City A showed similar trends, both peaking in November at 1800 and 1700 posts, respectively. City A’s growth was relatively steady, with occasional dips, such as in February and April.
Body 2
City D consistently had the lowest number of posts among the four cities, starting at 1100 in January and peaking at 1400 in November. The increase in posts for City D was more gradual compared to the other cities. From June to August, there was a slight decline before picking up again in September. The trends indicate that while all cities experienced growth, the rate and magnitude of this growth varied, with City B showing the most significant increase and City D the least.
Bài tham khảo 2
Introduction
The line graph illustrates the monthly number of posts on forums in four cities: City A, City B, City C, and City D throughout the year 2021.
Overview
Overall, the number of forum posts generally increased in all four cities over the year, with City B consistently having the highest number of posts and City D the lowest. There were some fluctuations, but the general trend showed a steady rise in forum activity across all cities.
Body 1
In January, City B started with the highest number of posts at 1500, while City D had the fewest at 1100. Throughout the first half of the year, City B maintained its lead, reaching 1700 posts by May. City A and City C followed similar patterns, with City A starting at 1200 posts in January and rising to 1400 by May, and City C starting at 1300 and increasing to 1500 in the same period. City D also saw a gradual increase, reaching 1250 posts in May.
Body 2
In the second half of the year, the upward trend continued. City B peaked in November with 2000 posts before slightly declining to 1950 in December. City A and City C showed similar growth patterns, with City A reaching 1700 posts in November and City C reaching 1800 in the same month. City D, despite being the city with the lowest number of posts, showed steady growth, peaking at 1400 posts in November before falling back to 1350 in December. Notably, all cities experienced their highest activity in November, indicating a potential peak period for forum interactions.
Conclusion
To conclude, all four cities experienced an increase in the number of forum posts throughout 2021, with City B consistently leading and City D having the least activity. This trend suggests a growing engagement in online forums across these cities over the year.
Bài tham khảo 3
The line graph illustrates the monthly number of forum posts in four cities (A, B, C, and D) throughout the year 2021.
Overall, all four cities show an upward trend in the number of forum posts over the year. City B consistently had the highest number of posts each month, while City D had the lowest. Cities A and C also saw significant increases, with City C starting to close the gap with City B towards the end of the year.
In the first half of the year, City B started with 1500 posts in January and gradually increased to 1800 posts by July. City A, which began with 1200 posts, experienced fluctuations but followed an upward trend, reaching 1500 posts by July. Similarly, City C’s posts rose from 1300 in January to 1600 by July, showing a steady increase each month. City D saw the least growth, starting with 1100 posts in January and reaching 1300 by July.
In the second half of the year, City B continued to lead, peaking at 2000 posts in November before slightly decreasing to 1950 in December. City A and City C followed similar patterns, with City A peaking at 1700 posts in November and City C at 1800 posts the same month. City D, although showing growth, maintained the lowest numbers, peaking at 1400 posts in November before ending the year at 1350.
In conclusion, the data reveals that all cities experienced growth in forum posts, with City B consistently having the highest numbers and City D the lowest. The trends suggest an increasing engagement in online forums across all cities throughout 2021.