IELTS Writing Task 1 yêu cầu bạn mô tả số lượng sinh viên tốt nghiệp hàng năm từ bốn trường đại học từ năm 2010 đến 2022. Bạn sẽ cần phân tích và so sánh dữ liệu để làm nổi bật các xu hướng, sự gia tăng hoặc giảm sút số lượng sinh viên, và bất kỳ biến động đáng chú ý nào trong suốt giai đoạn này.
Bạn có thể đọc lại bài nói về Task 1 tại đây: IELTS Writing Task 1 cần lưu ý những gì?
Bạn cũng có thể đọc thêm bài viết này vì đề bài này là IELTS Writing Task 1 biểu đồ Line Graph.
Bạn cũng có thể Xây Dựng Lộ Trình Cá Nhân Hóa của mình tại link.
IELTS Writing Task 1 Line Graph: Graduates
You should spent about 20 mintutes on this task
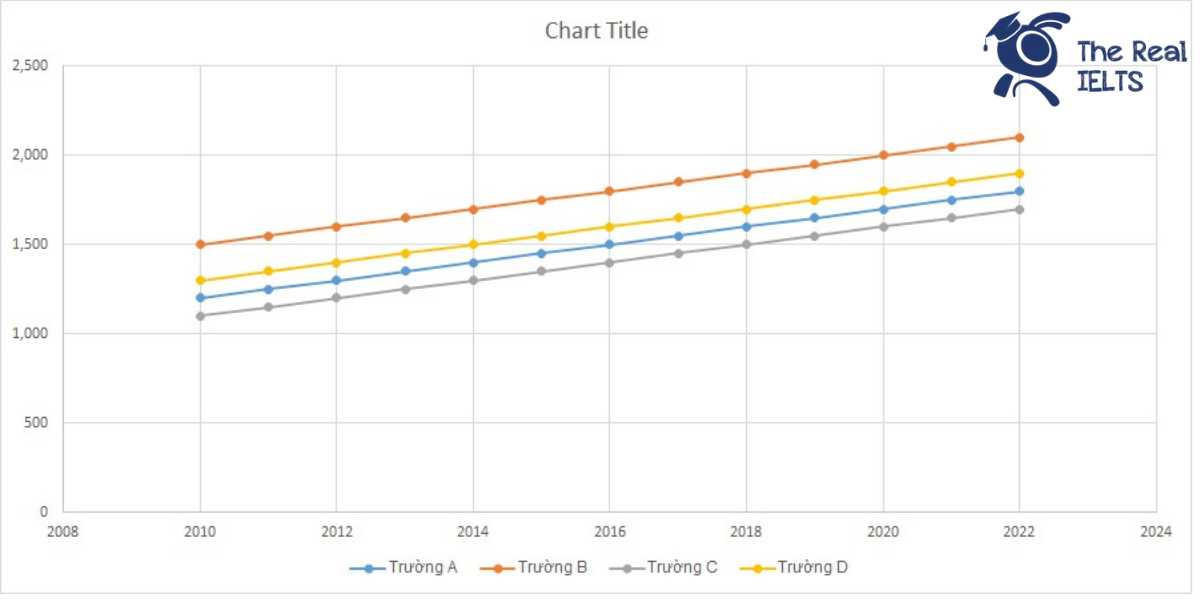
IELTS Writing Task 1 requires you to describe the annual number of graduates from four universities from 2010 to 2022. You will need to analyze and compare the data to highlight trends, increases or decreases in the number of students, and any notable fluctuations throughout this period.
You should write at least 150 words.
| Năm | Trường A | Trường B | Trường C | Trường D |
| 2010 | 1,200 | 1,500 | 1,100 | 1,300 |
| 2011 | 1,250 | 1,550 | 1,150 | 1,350 |
| 2012 | 1,300 | 1,600 | 1,200 | 1,400 |
| 2013 | 1,350 | 1,650 | 1,250 | 1,450 |
| 2014 | 1,400 | 1,700 | 1,300 | 1,500 |
| 2015 | 1,450 | 1,750 | 1,350 | 1,550 |
| 2016 | 1,500 | 1,800 | 1,400 | 1,600 |
| 2017 | 1,550 | 1,850 | 1,450 | 1,650 |
| 2018 | 1,600 | 1,900 | 1,500 | 1,700 |
| 2019 | 1,650 | 1,950 | 1,550 | 1,750 |
| 2020 | 1,700 | 2,000 | 1,600 | 1,800 |
| 2021 | 1,750 | 2,050 | 1,650 | 1,850 |
| 2022 | 1,800 | 2,100 | 1,700 | 1,900 |

Bài tham khảo 1
Introduction:
The table provides data on the number of graduates from four universities (A, B, C, and D) from 2010 to 2022.
Overview:
Overall, the number of graduates from all four universities showed a steady increase over the 12-year period. University B consistently had the highest number of graduates each year, while University C had the lowest.
Body 1:
In 2010, University A had 1,200 graduates, and this number increased annually, reaching 1,800 in 2022. Similarly, University B started with 1,500 graduates in 2010, and by 2022, it had 2,100 graduates. University B had the highest number of graduates each year, indicating its leading position among the four universities.
Body 2:
University C, which had the fewest graduates, also saw growth, starting at 1,100 in 2010 and rising to 1,700 in 2022. University D followed a similar trend, with its graduates increasing from 1,300 in 2010 to 1,900 in 2022. Despite these increases, University C consistently had the lowest number of graduates each year.
Conclusion:
In summary, all four universities experienced a continuous rise in the number of graduates from 2010 to 2022, with University B maintaining the highest and University C the lowest number of graduates annually.
Bài tham khảo 2
Introduction
The table provides data on the number of students graduating annually from four universities (A, B, C, and D) from 2010 to 2022.
Overview
Overall, the number of graduates from all four universities showed a steady increase over the period. University B consistently had the highest number of graduates each year, while University C had the lowest.
Body 1
In 2010, University B had the highest number of graduates at 1,500, followed by University D with 1,300, University A with 1,200, and University C with 1,100. The number of graduates from University B increased consistently each year, reaching 2,100 by 2022. Similarly, University A saw a gradual increase from 1,200 in 2010 to 1,800 in 2022.
Body 2
University D and University C also experienced growth in their number of graduates. University D’s graduates increased from 1,300 in 2010 to 1,900 in 2022, while University C saw a rise from 1,100 to 1,700 over the same period. Despite having the lowest number of graduates each year, University C’s growth pattern was similar to the other universities, showing a steady annual increase.
In conclusion, all four universities demonstrated a positive trend in the number of graduates over the twelve-year period, with University B maintaining its position as the institution with the highest number of graduates each year.
Bài tham khảo 3
Introduction
The table illustrates the number of graduates from four universities (A, B, C, and D) over a period of 13 years, from 2010 to 2022.
Overview
Overall, the number of graduates from all four universities showed a steady increase throughout the period. University B consistently had the highest number of graduates each year, while University C had the lowest number of graduates initially but saw significant growth by the end of the period.
Body 1
In 2010, University B had the most graduates with 1,500, followed by University D with 1,300, University A with 1,200, and University C with 1,100. Over the years, University B maintained its lead, reaching 2,100 graduates by 2022. University A and D also saw considerable increases, with University A rising to 1,800 graduates and University D reaching 1,900 graduates in 2022.
Body 2
University C, despite starting with the lowest number of graduates, showed a remarkable upward trend. From 1,100 graduates in 2010, the number increased steadily each year, reaching 1,700 in 2022. This growth, while significant, still left University C with the lowest number of graduates among the four universities by the end of the period. In contrast, University B’s substantial increase, from 1,500 to 2,100 graduates, highlights its leading position in terms of graduate output.
Overall, all universities experienced growth in graduate numbers, reflecting an upward trend in higher education participation over the analyzed period.
Bài tham khảo 4
The table illustrates the number of graduates from four universities (A, B, C, and D) annually from 2010 to 2022.
Overview:
Overall, all four universities experienced a steady increase in the number of graduates over the given period. University B consistently had the highest number of graduates each year, while University C had the lowest numbers.
Body 1:
In 2010, University B had the highest number of graduates with 1,500, followed by University D with 1,300. University A and University C had 1,200 and 1,100 graduates, respectively. Over the next few years, all universities saw a gradual increase in their graduate numbers. By 2015, University B’s graduates rose to 1,750, while University A reached 1,450. University C and D recorded 1,350 and 1,550 graduates, respectively.
Body 2:
From 2016 to 2022, the trend of increasing graduates continued for all universities. By 2022, University B had the highest number of graduates at 2,100, a significant rise from its 2010 figure. University A’s graduates reached 1,800, while University C and D had 1,700 and 1,900 graduates, respectively. The data highlights a consistent growth pattern across all four universities, with University B maintaining the lead in graduate numbers throughout the period.
In conclusion, the table demonstrates a consistent and steady increase in the number of graduates from all four universities between 2010 and 2022, with University B having the highest number of graduates each year.