IELTS Writing Task 1 yêu cầu phân tích biểu đồ về tỷ lệ sử dụng dịch vụ y tế hàng tháng năm 2021 tại bốn quốc gia. Người viết cần mô tả, so sánh các số liệu và xu hướng chính, đồng thời sử dụng từ vựng và cấu trúc câu phù hợp để trình bày thông tin một cách rõ ràng và logic.
Bạn có thể đọc lại bài nói về Task 1 tại đây: IELTS Writing Task 1 cần lưu ý những gì?
Bạn cũng có thể đọc thêm bài viết này vì đề bài này là IELTS Writing Task 1 biểu đồ Line Graph.
Bạn cũng có thể Xây Dựng Lộ Trình Cá Nhân Hóa của mình tại link.
IELTS Writing Task 1 Line Graph: Healthcare Services
You should spent about 20 mintutes on this task
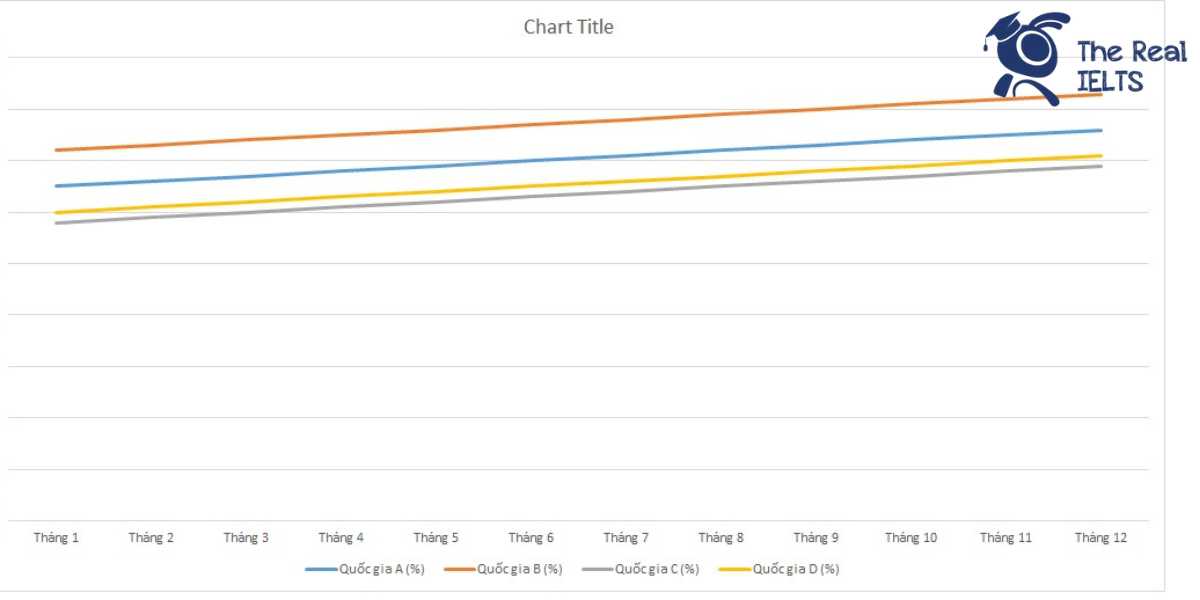
IELTS Writing Task 1 requires analyzing a chart about the monthly usage rates of healthcare services in 2021 across four countries. The writer needs to describe and compare the data and main trends while using appropriate vocabulary and sentence structures to present the information clearly and logically.
You should write at least 150 words.
| Tháng | Quốc gia A (%) | Quốc gia B (%) | Quốc gia C (%) | Quốc gia D (%) |
| Tháng 1 | 65,000 | 72,000 | 58,000 | 60,000 |
| Tháng 2 | 66,000 | 73,000 | 59,000 | 61,000 |
| Tháng 3 | 67,000 | 74,000 | 60,000 | 62,000 |
| Tháng 4 | 68,000 | 75,000 | 61,000 | 63,000 |
| Tháng 5 | 69,000 | 76,000 | 62,000 | 64,000 |
| Tháng 6 | 70,000 | 77,000 | 63,000 | 65,000 |
| Tháng 7 | 71,000 | 78,000 | 64,000 | 66,000 |
| Tháng 8 | 72,000 | 79,000 | 65,000 | 67,000 |
| Tháng 9 | 73,000 | 80,000 | 66,000 | 68,000 |
| Tháng 10 | 74,000 | 81,000 | 67,000 | 69,000 |
| Tháng 11 | 75,000 | 82,000 | 68,000 | 70,000 |
| Tháng 12 | 76,000 | 83,000 | 69,000 | 71,000 |

Bài tham khảo 1
Introduction: The table provides data on the monthly utilization rates of healthcare services in four countries (A, B, C, and D) throughout the year 2021.
Overview: Overall, the healthcare service utilization rates increased steadily in all four countries over the year. Country B consistently had the highest rates, while Country C had the lowest. Countries A and D followed similar upward trends, with Country D always having slightly higher utilization rates than Country A.
Body 1: At the beginning of the year, Country A had a healthcare service utilization rate of 65%, which gradually increased to 76% by December. Similarly, Country D started at 60% in January and reached 71% by the end of the year. Both countries exhibited a consistent upward trend, with Country D maintaining a slight lead over Country A throughout the year.
Body 2: Country B had the highest utilization rates, starting at 72% in January and rising to 83% in December. On the other hand, Country C began with the lowest rate of 58% in January and ended with 69% in December. The data indicates that although all countries experienced growth in healthcare service utilization, Country B had the most significant increase, while Country C, despite being the lowest, also showed a notable improvement.
Bài tham khảo 2
Introduction
The provided table illustrates the monthly percentages of healthcare service usage in four different countries (A, B, C, and D) throughout the year 2021.
Overview
Overall, all four countries showed a consistent increase in the usage of healthcare services over the year. Notably, Country B had the highest percentage each month, while Country C had the lowest.
Body 1
Starting with January, Country B led with 72%, followed by Country A with 65%, Country D at 60%, and Country C at 58%. As the year progressed, all countries experienced a steady rise in their usage rates. By mid-year, in June, Country B’s usage had increased to 77%, maintaining its lead. Meanwhile, Country A’s usage reached 70%, Country D’s 65%, and Country C’s 63%.
Body 2
In the latter half of the year, this upward trend continued. By December, Country B’s healthcare service usage peaked at 83%, while Country A’s usage rose to 76%. Country D and Country C ended the year at 71% and 69%, respectively. The steady increase across all countries highlights a consistent growth in the demand for healthcare services over 2021, with Country B consistently having the highest usage rates.
Bài tham khảo 3
Introduction: The table illustrates the monthly usage rates of healthcare services in four countries (A, B, C, and D) throughout the year 2021. The percentages represent the proportion of the population in each country that utilized these services.
Overview: Overall, the data shows a consistent upward trend in the utilization of healthcare services across all four countries over the year. Country B consistently had the highest usage rates each month, while Country C had the lowest.
Body 1: In January, the usage rates ranged from 58% in Country C to 72% in Country B. Throughout the year, each country experienced a steady increase in their respective rates. By June, Country A had risen from 65% to 70%, Country B from 72% to 77%, Country C from 58% to 63%, and Country D from 60% to 65%. This pattern of gradual monthly increases continued consistently for all countries.
Body 2: By December, the usage rates peaked, with Country A reaching 76%, Country B at 83%, Country C at 69%, and Country D at 71%. Country B maintained the highest monthly utilization rates throughout the year, increasing by 11 percentage points from January to December. Country A also saw significant growth, with an 11 percentage point increase. Country C and Country D both saw slightly smaller increases of 11 percentage points each, maintaining their positions as the countries with the lowest and the second-lowest rates, respectively.
Conclusion: In summary, the data indicates a clear upward trend in healthcare service usage in all four countries over the course of 2021, with Country B consistently having the highest rates and Country C the lowest.
Bài tham khảo 4
The table presents the monthly healthcare service usage rates in 2021 for four countries: Country A, Country B, Country C, and Country D.
Overall, all four countries showed a steady increase in healthcare service usage throughout the year, with Country B consistently having the highest usage rates and Country C the lowest.
In the first half of the year, Country B led in healthcare usage, starting at 72% in January and increasing to 77% in June. Country A followed, rising from 65% to 70%, while Country D and Country C had slightly lower rates, increasing from 60% to 65% and 58% to 63%, respectively.
In the latter half of the year, the trend of increasing usage continued. By December, Country B’s usage peaked at 83%, maintaining its lead. Country A saw its usage rise to 76%, and Country D to 71%. Country C, while consistently the lowest, still showed an increase, ending the year at 69%.
In summary, the data indicates a consistent upward trend in healthcare service usage across all four countries, with Country B showing the highest rates and Country C the lowest throughout 2021.
Bài tham khảo 5
Introduction
The table provides information on the monthly utilization rates of healthcare services in four countries (A, B, C, and D) for the year 2021.
Overview
Overall, the data shows a consistent increase in the usage of healthcare services across all four countries over the year. Country B consistently had the highest usage rates, while Country C had the lowest.
Body 1
In January, the percentage of healthcare service usage started at 65% for Country A, 72% for Country B, 58% for Country C, and 60% for Country D. By the mid-year mark in June, these percentages rose steadily to 70% for Country A, 77% for Country B, 63% for Country C, and 65% for Country D. This trend of increasing usage continues throughout the year.
Body 2
By December, the utilization rates reached their peak values with Country A at 76%, Country B at 83%, Country C at 69%, and Country D at 71%. The consistent month-on-month rise highlights a significant upward trend in healthcare service usage, with Country B showing the most substantial increase from 72% in January to 83% in December, and Country C showing the smallest overall increase from 58% to 69% over the same period.