Trong năm 2020, IELTS Writing Task 1 yêu cầu mô tả số lượng hợp đồng bảo hiểm mới hàng tháng của 4 quốc gia khác nhau. Bao gồm Mỹ, Anh, Úc và Đức, nhiệm vụ này đòi hỏi thí sinh phân tích và so sánh dữ liệu thống kê từ biểu đồ cột hoặc đường. Việc phân tích sự thay đổi và xu hướng của các quốc gia là cần thiết để viết báo cáo hoàn chỉnh và logic.
Bạn có thể đọc lại bài nói về Task 1 tại đây: IELTS Writing Task 1 cần lưu ý những gì?
Bạn cũng có thể đọc thêm bài viết này vì đề bài này là IELTS Writing Task 1 biểu đồ Line Graph.
IELTS Writing Task 1 Line Graph: Insurance Contracts
You should spent about 20 mintutes on this task
In 2020, IELTS Writing Task 1 required describing the monthly number of new insurance contracts in four different countries, namely the United States, the United Kingdom, Australia, and Germany. This task demanded candidates to analyze and compare statistical data from bar or line charts. Analyzing the changes and trends across these countries was essential for crafting a comprehensive and logical report.
You should write at least 150 words.
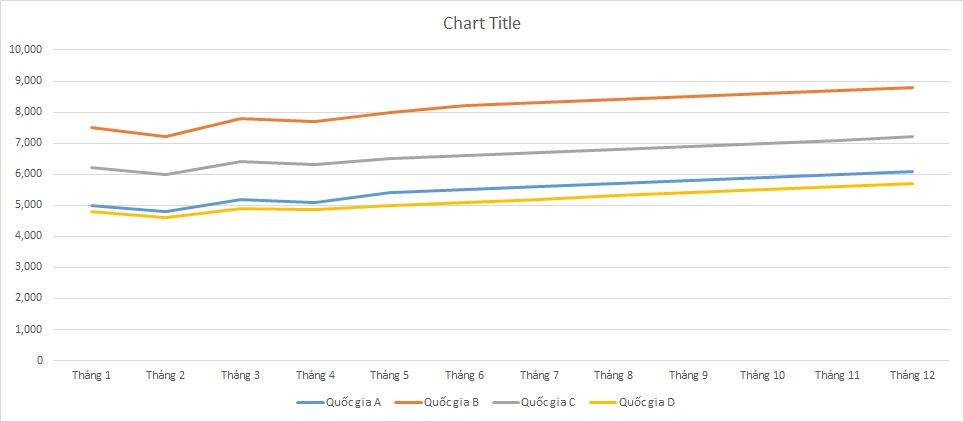
| Tháng | Quốc gia A | Quốc gia B | Quốc gia C | Quốc gia D |
| Tháng 1 | 5,000 | 7,500 | 6,200 | 4,800 |
| Tháng 2 | 4,800 | 7,200 | 6,000 | 4,600 |
| Tháng 3 | 5,200 | 7,800 | 6,400 | 4,900 |
| Tháng 4 | 5,100 | 7,700 | 6,300 | 4,850 |
| Tháng 5 | 5,400 | 8,000 | 6,500 | 5,000 |
| Tháng 6 | 5,500 | 8,200 | 6,600 | 5,100 |
| Tháng 7 | 5,600 | 8,300 | 6,700 | 5,200 |
| Tháng 8 | 5,700 | 8,400 | 6,800 | 5,300 |
| Tháng 9 | 5,800 | 8,500 | 6,900 | 5,400 |
| Tháng 10 | 5,900 | 8,600 | 7,000 | 5,500 |
| Tháng 11 | 6,000 | 8,700 | 7,100 | 5,600 |
| Tháng 12 | 6,100 | 8,800 | 7,200 | 5,700 |
Bài tham khảo 1
The table shows the monthly sales of new insurance contracts in four countries (A, B, C, and D) throughout the year 2020.
Overview: Overall, all four countries experienced a gradual increase in the number of new insurance contracts over the year. Country B consistently had the highest number of contracts each month, while Country D had the lowest.
Body 1: At the beginning of the year, in January, Country B led with 7,500 new contracts, followed by Country C with 6,200, Country A with 5,000, and Country D with 4,800. This trend of Country B having the highest sales and Country D the lowest continued throughout the year. By mid-year, in June, Country B’s contracts increased to 8,200, while Country A, C, and D had 5,500, 6,600, and 5,100 contracts respectively.
Body 2: In the latter half of the year, the upward trend persisted. By December, Country B reached 8,800 new contracts, which was the highest among all countries. Country C followed with 7,200 contracts, then Country A with 6,100, and Country D with 5,700. The steady rise in the number of new contracts in all four countries indicates a growing demand for insurance throughout the year.
In summary, the data reflects a consistent increase in new insurance contracts across all four countries, with Country B maintaining the lead each month and Country D lagging behind.
Bài tham khảo 2
The table illustrates the number of new insurance contracts signed monthly in four countries (A, B, C, and D) throughout the year 2020.
Overall, the number of new insurance contracts in all four countries showed an upward trend over the year. Country B consistently had the highest number of new contracts each month, while Country D had the lowest.
In detail, Country A started the year with 5,000 new contracts in January, which gradually increased to 6,100 by December. Country B had the highest number of new contracts each month, beginning with 7,500 in January and peaking at 8,800 in December. Country C followed a similar trend, starting at 6,200 in January and rising to 7,200 by the end of the year.
Country D, which had the lowest numbers, started with 4,800 new contracts in January. Despite having the least growth, the number still rose steadily, ending the year with 5,700 new contracts in December. Notably, the monthly increases for all four countries were relatively consistent, with slight fluctuations that did not significantly alter the overall upward trend.
In conclusion, all four countries experienced growth in the number of new insurance contracts throughout 2020, with Country B leading significantly and Country D trailing behind.
Bài tham khảo 3
Introduction
The table provides monthly data on the sales of new insurance contracts in four countries (A, B, C, and D) throughout the year 2020.
Overview
Overall, Country B consistently had the highest number of new insurance contracts each month, while Country D had the lowest. There was a general upward trend in the number of contracts sold across all countries as the year progressed.
Body 1
Country B started with 7,500 contracts in January and experienced a steady increase each month, reaching 8,800 contracts in December. Similarly, Country A began with 5,000 contracts in January, showing a gradual rise and ending the year with 6,100 contracts in December. Country C’s figures also followed an upward trend, starting at 6,200 in January and culminating in 7,200 by December.
Body 2
Country D had the lowest figures throughout the year, beginning with 4,800 in January and incrementally increasing to 5,700 by December. Despite having the smallest numbers, Country D mirrored the general trend of growth seen in the other countries. The overall data indicates a positive trend in the number of new insurance contracts across all four countries in 2020.