Trong IELTS Writing Task 1, bạn sẽ phân tích số liệu về số lượng sinh viên quốc tế từ bốn quốc gia từ năm 2011 đến 2022. Bài viết yêu cầu bạn phân tích và so sánh xu hướng tăng giảm của số lượng sinh viên đến từ mỗi quốc gia trong khoảng thời gian này. Điều này giúp bạn phát triển kỹ năng mô tả và phân tích dữ liệu, sử dụng các từ vựng chính xác như “tăng, giảm, dao động, đỉnh điểm” để miêu tả xu hướng và con số cụ thể.
Bạn có thể đọc lại bài nói về Task 1 tại đây: IELTS Writing Task 1 cần lưu ý những gì?
Bạn cũng có thể đọc thêm bài viết này vì đề bài này là IELTS Writing Task 1 biểu đồ Line Graph.
Bạn cũng có thể Xây Dựng Lộ Trình Cá Nhân Hóa của mình tại link.
IELTS Writing Task 1 Line Graph: International Students
You should spent about 20 mintutes on this task.
In IELTS Writing Task 1, you will analyze data on the number of international students from four countries from 2011 to 2022. The task requires you to analyze and compare the trends of increase or decrease in the number of students from each country during this period. This helps you develop skills in describing and analyzing data, using precise vocabulary such as “increase, decrease, fluctuate, peak” to describe trends and specific figures.
You should write at least 150 words.
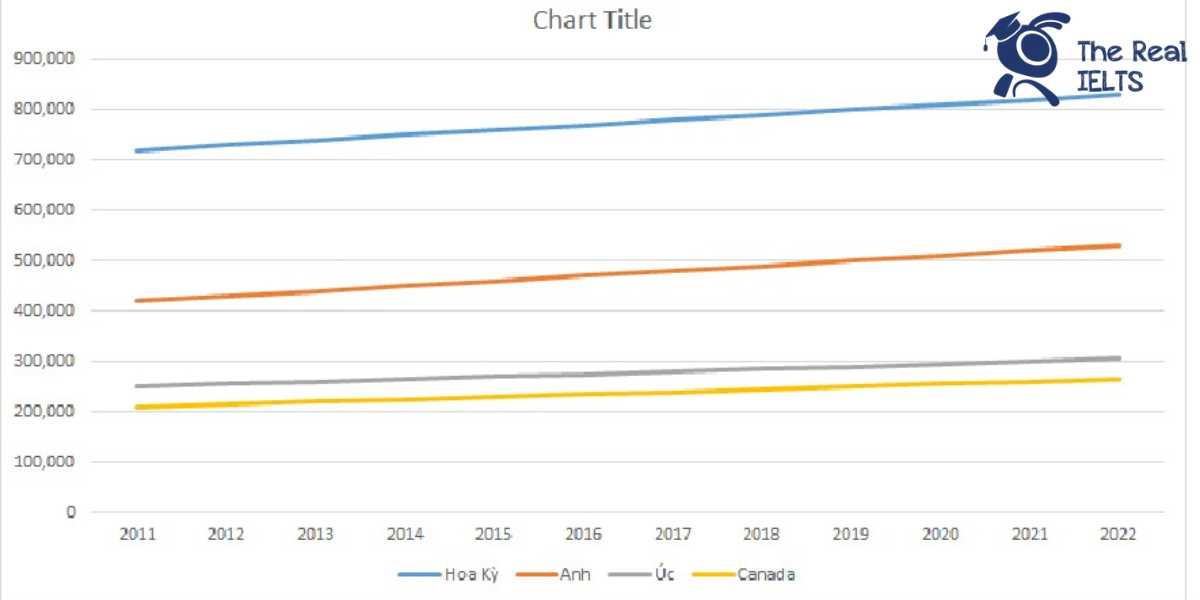
| Năm | Hoa Kỳ | Anh | Úc | Canada |
| 2011 | 720,000 | 420,000 | 250,000 | 210,000 |
| 2012 | 730,000 | 430,000 | 255,000 | 215,000 |
| 2013 | 740,000 | 440,000 | 260,000 | 220,000 |
| 2014 | 750,000 | 450,000 | 265,000 | 225,000 |
| 2015 | 760,000 | 460,000 | 270,000 | 230,000 |
| 2016 | 770,000 | 470,000 | 275,000 | 235,000 |
| 2017 | 780,000 | 480,000 | 280,000 | 240,000 |
| 2018 | 790,000 | 490,000 | 285,000 | 245,000 |
| 2019 | 800,000 | 500,000 | 290,000 | 250,000 |
| 2020 | 810,000 | 510,000 | 295,000 | 255,000 |
| 2021 | 820,000 | 520,000 | 300,000 | 260,000 |
| 2022 | 830,000 | 530,000 | 305,000 | 265,000 |

Bài tham khảo 1
The table illustrates the annual number of international students from 2011 to 2022 in four countries: the United States, the United Kingdom, Australia, and Canada.
Overview:
Overall, all four countries saw a steady increase in the number of international students over the given period. The United States consistently had the highest number of international students, while Canada had the lowest.
Body 1:
In 2011, the United States hosted the most international students with 720,000, followed by the United Kingdom with 420,000, Australia with 250,000, and Canada with 210,000. This upward trend continued each year across all countries. By 2016, the number of international students in the United States had risen to 770,000, in the United Kingdom to 470,000, in Australia to 275,000, and in Canada to 235,000.
Body 2:
From 2017 to 2022, this trend of increasing international student numbers persisted. The United States reached 830,000 students by 2022, maintaining its lead. The United Kingdom followed, reaching 530,000 students, while Australia and Canada saw their international student numbers increase to 305,000 and 265,000, respectively. This consistent growth indicates a rising global interest in pursuing education in these four countries.
In conclusion, the data shows a significant and consistent rise in the number of international students in all four countries from 2011 to 2022, with the United States remaining the most popular destination throughout the period.
Bài tham khảo 2
Introduction
The table illustrates the number of international students in four countries, namely the United States, the United Kingdom, Australia, and Canada, from 2011 to 2022.
Overview
Overall, the number of international students increased in all four countries over the given period. The United States consistently had the highest number of international students each year, while Australia had the lowest.
Body 1
In 2011, the United States had 720,000 international students, which rose steadily each year to reach 830,000 by 2022. The United Kingdom followed a similar trend, starting with 420,000 students in 2011 and increasing by 10,000 students each year to reach 530,000 in 2022.
Body 2
Australia and Canada had lower numbers of international students compared to the United States and the United Kingdom, but they also saw a steady increase over the years. In Australia, the number of international students grew from 250,000 in 2011 to 305,000 in 2022. Similarly, Canada saw an increase from 210,000 in 2011 to 265,000 in 2022. Despite having the lowest numbers, both countries showed a consistent upward trend in attracting international students.
Bài tham khảo 3
Introduction
The table provides statistical data on the number of international students in four countries—United States, United Kingdom, Australia, and Canada—from 2011 to 2022.
Overview
Overall, the number of international students increased steadily in all four countries over the twelve-year period. The United States consistently had the highest number of international students, while Canada had the lowest.
Body 1
In 2011, the United States hosted 720,000 international students, which increased annually to reach 830,000 by 2022. Similarly, the United Kingdom saw an increase from 420,000 students in 2011 to 530,000 in 2022. This trend indicates a steady growth in the attractiveness of these countries as study destinations for international students.
Body 2
Australia and Canada also experienced consistent growth, though on a smaller scale compared to the US and UK. Australia had 250,000 international students in 2011, rising to 305,000 by 2022. Canada started with 210,000 students in 2011 and increased to 265,000 in 2022. Despite the smaller numbers, both countries showed a positive trend in attracting more international students over the years.
Bài tham khảo 4
The table illustrates the annual number of international students in four countries, namely the USA, the UK, Australia, and Canada, from 2011 to 2022.
Overall, the number of international students in all four countries shows a consistent upward trend over the 12-year period. The USA consistently has the highest number of international students, while Canada has the lowest, although both countries, along with the UK and Australia, experience steady growth.
In detail, the USA started with 720,000 international students in 2011 and saw a yearly increase, reaching 830,000 by 2022. Similarly, the UK saw its international student population rise from 420,000 in 2011 to 530,000 in 2022. This consistent growth highlights the increasing attractiveness of these two countries to international students over the years.
Meanwhile, Australia and Canada also experienced steady growth in their international student populations. Australia’s numbers increased from 250,000 in 2011 to 305,000 in 2022, while Canada saw an increase from 210,000 to 265,000 over the same period. Despite having lower absolute numbers compared to the USA and the UK, both countries showed a similar trend of rising numbers, indicating their growing appeal as study destinations.
In summary, all four countries experienced a significant rise in the number of international students from 2011 to 2022, with the USA maintaining the lead, followed by the UK, Australia, and Canada.
Bài tham khảo 5
The table illustrates the annual number of international students from 2011 to 2022 across four countries: the United States, the United Kingdom, Australia, and Canada.
Overall, it is evident that all four countries experienced a steady increase in the number of international students over the given period. However, the United States consistently hosted the largest number of international students, while Canada saw the smallest figures.
In detail, the number of international students in the United States rose from 720,000 in 2011 to 830,000 in 2022, marking a growth of 110,000 students. Similarly, the United Kingdom witnessed a consistent increase, with numbers climbing from 420,000 in 2011 to 530,000 in 2022, an increase of 110,000 students as well.
Australia and Canada also saw upward trends in international student enrollment, though at a slower rate. Australia’s figures grew from 250,000 in 2011 to 305,000 in 2022, an increase of 55,000 students. Canada’s increase was the smallest, rising from 210,000 in 2011 to 265,000 in 2022, adding 55,000 students. This pattern reflects a general upward trend in international education across these countries, with the United States and the United Kingdom leading the increase.