IELTS Writing Task 1 yêu cầu thí sinh mô tả và so sánh lượng tiêu thụ sữa trong 12 tuần của bốn công ty khác nhau. Đề bài thường bao gồm một biểu đồ hoặc bảng số liệu, và thí sinh cần phân tích xu hướng, điểm nổi bật, và sự biến đổi trong dữ liệu, từ đó viết một báo cáo mạch lạc và logic.
Bạn có thể đọc lại bài nói về Task 1 tại đây: IELTS Writing Task 1 cần lưu ý những gì?
Bạn cũng có thể đọc thêm bài viết này vì đề bài này là IELTS Writing Task 1 biểu đồ Line Graph.
Bạn cũng có thể Xây Dựng Lộ Trình Cá Nhân Hóa của mình tại link.
IELTS Writing Task 1 Line Graph: Milk Consumption
You should spent about 20 mintutes on this task
IELTS Writing Task 1 requires candidates to describe and compare the milk consumption over 12 weeks of four different companies. The task usually includes a chart or table, and candidates need to analyze trends, highlights, and variations in the data, then write a coherent and logical report.
You should write at least 150 words.
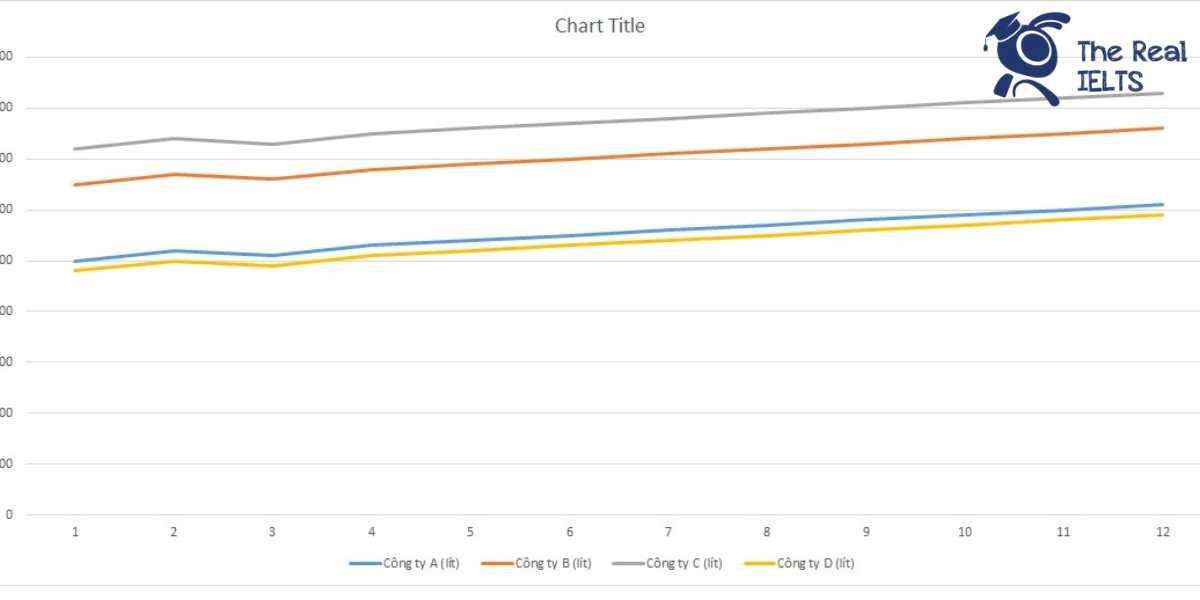
| Tuần | Công ty A (lít) | Công ty B (lít) | Công ty C (lít) | Công ty D (lít) |
| 1 | 5,000 | 6,500 | 7,200 | 4,800 |
| 2 | 5,200 | 6,700 | 7,400 | 5,000 |
| 3 | 5,100 | 6,600 | 7,300 | 4,900 |
| 4 | 5,300 | 6,800 | 7,500 | 5,100 |
| 5 | 5,400 | 6,900 | 7,600 | 5,200 |
| 6 | 5,500 | 7,000 | 7,700 | 5,300 |
| 7 | 5,600 | 7,100 | 7,800 | 5,400 |
| 8 | 5,700 | 7,200 | 7,900 | 5,500 |
| 9 | 5,800 | 7,300 | 8,000 | 5,600 |
| 10 | 5,900 | 7,400 | 8,100 | 5,700 |
| 11 | 6,000 | 7,500 | 8,200 | 5,800 |
| 12 | 6,100 | 7,600 | 8,300 | 5,900 |

Bài tham khảo 1
Introduction
The table illustrates the milk consumption of four companies (A, B, C, and D) over a 12-week period. The data is presented in liters for each week, showing the weekly milk consumption trends of these companies.
Overview
Overall, all four companies experienced a steady increase in milk consumption over the 12 weeks. Company C consistently consumed the most milk each week, while Company D had the lowest consumption throughout the period.
Body 1
At the beginning of the period, in week 1, Company C had the highest milk consumption at 7,200 liters, followed by Company B with 6,500 liters. Company A and Company D consumed 5,000 liters and 4,800 liters respectively. Throughout the weeks, all companies showed a gradual increase in their milk consumption. By week 6, Company C’s consumption had increased to 7,700 liters, while Company B reached 7,000 liters. Company A and Company D also saw increases to 5,500 liters and 5,300 liters respectively.
Body 2
In the latter half of the period, the upward trend continued for all companies. By week 12, Company C had the highest consumption at 8,300 liters, a significant increase from the initial 7,200 liters. Company B also saw a notable rise, ending the period at 7,600 liters. Company A’s consumption increased to 6,100 liters, while Company D, despite being the lowest consumer, reached 5,900 liters by the end of week 12. This consistent increase across all companies indicates a growing demand for milk over the 12-week period.
Bài tham khảo 2
The table provides information on the milk consumption of four companies (A, B, C, and D) over a period of 12 weeks.
Overall, Company C consistently consumed the highest amount of milk each week, while Company D had the lowest consumption. All four companies showed a gradual increase in milk consumption over the 12-week period.
In the first six weeks, Company C had the highest milk consumption, starting at 7,200 liters in week 1 and increasing to 7,700 liters by week 6. Company B followed, starting at 6,500 liters and rising to 7,000 liters. Company A’s consumption began at 5,000 liters and increased to 5,500 liters, whereas Company D’s consumption started at 4,800 liters and reached 5,300 liters by week 6.
In the latter half of the period, the trend continued with all companies increasing their milk consumption. By week 12, Company C reached 8,300 liters, maintaining its leading position. Company B followed with 7,600 liters, and Company A increased to 6,100 liters. Company D remained the lowest consumer, with a consumption of 5,900 liters by week 12.
In conclusion, while all companies showed a steady increase in milk consumption, Company C consistently led in consumption throughout the 12 weeks, and Company D had the lowest consumption.
Bài tham khảo 3
The table shows the milk consumption of four companies over a 12-week period, measured in liters.
Overall, Company C consistently consumed the most milk each week, followed by Company B, Company A, and finally Company D, which had the lowest consumption. All companies experienced a steady increase in milk consumption throughout the 12 weeks.
In the first six weeks, Company C’s consumption rose from 7,200 liters to 7,700 liters, leading the group each week. Company B followed, starting at 6,500 liters and increasing to 7,000 liters. Company A’s consumption began at 5,000 liters and grew to 5,500 liters by week 6. Company D, with the lowest initial consumption of 4,800 liters, saw an increase to 5,300 liters.
In the latter six weeks, the trend of steady increase continued for all companies. By week 12, Company C reached 8,300 liters, maintaining its lead. Company B consumed 7,600 liters, while Company A reached 6,100 liters. Company D’s consumption rose to 5,900 liters, remaining the lowest among the four but still showing consistent growth.
In summary, all four companies showed a clear upward trend in milk consumption over the 12-week period, with Company C consistently leading and Company D trailing throughout the duration.
Bài tham khảo 4
Introduction
The table provides data on the milk consumption of four companies (A, B, C, and D) over a period of 12 weeks. The figures are given in liters.
Overview
Overall, all four companies exhibited an upward trend in milk consumption over the 12-week period. Company C consistently had the highest consumption, while Company D had the lowest. Company A and Company B showed a steady increase in their milk consumption, though Company B consumed more milk than Company A throughout the period.
Body 1
In the first week, Company C consumed the most milk at 7,200 liters, followed by Company B with 6,500 liters. Company A and Company D had lower consumption levels at 5,000 liters and 4,800 liters, respectively. Over the next few weeks, all companies showed a gradual increase in their milk consumption. By the sixth week, Company A’s consumption had increased to 5,500 liters, Company B’s to 7,000 liters, Company C’s to 7,700 liters, and Company D’s to 5,300 liters.
Body 2
From week seven to week twelve, the upward trend continued. In week seven, Company A consumed 5,600 liters, while Company B, C, and D consumed 7,100 liters, 7,800 liters, and 5,400 liters, respectively. By the final week, Company A’s milk consumption reached 6,100 liters. Company B and Company C consumed 7,600 liters and 8,300 liters, respectively. Company D’s consumption also increased steadily, ending at 5,900 liters. This consistent growth pattern highlights an overall increase in milk consumption across all companies over the 12-week period.
Bài tham khảo 5
Introduction
The table provides data on the weekly milk consumption (in liters) of four companies (A, B, C, and D) over a 12-week period.
Overview
Overall, all four companies experienced a steady increase in milk consumption over the 12 weeks. Company C consistently consumed the highest amount of milk, while Company D had the lowest consumption each week.
Body 1
At the beginning of the period, in week 1, Company C consumed the most milk at 7,200 liters, followed by Company B with 6,500 liters, Company A with 5,000 liters, and Company D with 4,800 liters. Over the following weeks, there was a gradual increase in milk consumption for all companies. By week 6, Company A’s consumption rose to 5,500 liters, while Company B, Company C, and Company D’s consumption increased to 7,000 liters, 7,700 liters, and 5,300 liters, respectively.
Body 2
The trend of increasing milk consumption continued throughout the latter half of the 12-week period. By week 12, Company A’s consumption had increased to 6,100 liters, Company B to 7,600 liters, Company C to 8,300 liters, and Company D to 5,900 liters. The data indicates that despite the consistent increases across all companies, Company C maintained the highest level of milk consumption, and Company D remained the lowest throughout the 12 weeks.