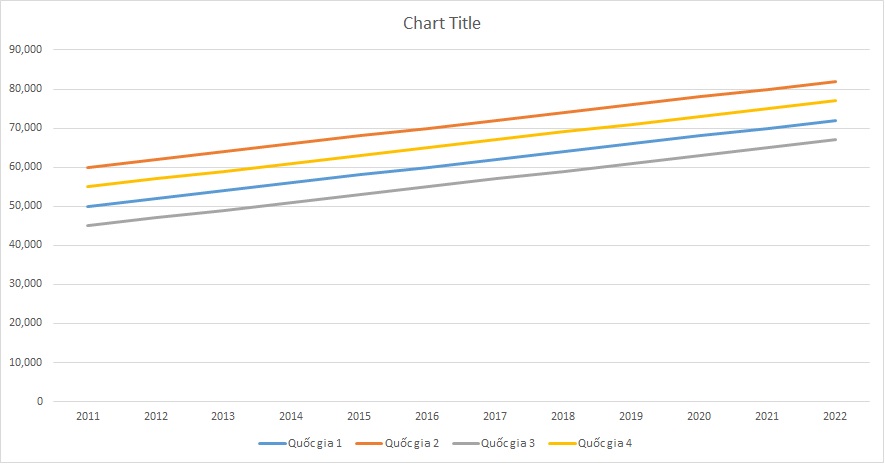
IELTS Writing Task 1 yêu cầu thí sinh phân tích và mô tả dữ liệu đồ thị, bảng biểu. Đề bài có thể yêu cầu so sánh, phân tích xu hướng. Ví dụ, từ năm 2011 đến năm 2022, số lượng nhà mới xây hàng năm tại Mỹ, Anh, Trung Quốc và Úc đã thay đổi như thế nào? Thí sinh cần chú ý sử dụng các từ vựng chuyên ngành, biểu đồ để miêu tả xu hướng và so sánh một cách hiệu quả.
Bạn có thể đọc lại bài nói về Task 1 tại đây: IELTS Writing Task 1 cần lưu ý những gì?
Bạn cũng có thể đọc thêm bài viết này vì đề bài này là IELTS Writing Task 1 biểu đồ Line Graph.
Bạn cũng có thể Xây Dựng Lộ Trình Cá Nhân Hóa của mình tại link.
IELTS Writing Task 1 Line Graph: New Houses
You should spent about 20 mintutes on this task
IELTS Writing Task 1 requires candidates to analyze and describe data presented in graphs and tables. Tasks may involve comparisons and trend analysis. For example, from 2011 to 2022, how has the annual number of new houses built in the US, UK, China, and Australia changed? Candidates should focus on using specialized vocabulary, charts to describe trends, and make effective comparisons.
You should write at least 150 words.
| Năm | Quốc gia 1 | Quốc gia 2 | Quốc gia 3 | Quốc gia 4 |
| 2011 | 50,000 | 60,000 | 45,000 | 55,000 |
| 2012 | 52,000 | 62,000 | 47,000 | 57,000 |
| 2013 | 54,000 | 64,000 | 49,000 | 59,000 |
| 2014 | 56,000 | 66,000 | 51,000 | 61,000 |
| 2015 | 58,000 | 68,000 | 53,000 | 63,000 |
| 2016 | 60,000 | 70,000 | 55,000 | 65,000 |
| 2017 | 62,000 | 72,000 | 57,000 | 67,000 |
| 2018 | 64,000 | 74,000 | 59,000 | 69,000 |
| 2019 | 66,000 | 76,000 | 61,000 | 71,000 |
| 2020 | 68,000 | 78,000 | 63,000 | 73,000 |
| 2021 | 70,000 | 80,000 | 65,000 | 75,000 |
| 2022 | 72,000 | 82,000 | 67,000 | 77,000 |


Bài tham khảo 1
Introduction
The table illustrates the annual number of new houses built in four different countries from 2011 to 2022.
Overview
Overall, all four countries experienced a steady increase in the number of new houses constructed over the twelve-year period. Country 2 consistently had the highest number of new houses built each year, while Country 3 had the lowest figures throughout the period.
Body 1
In 2011, Country 2 started with 60,000 new houses, leading the four countries. By 2022, this number had risen significantly to 82,000. Country 1 followed a similar upward trend, beginning at 50,000 houses in 2011 and reaching 72,000 by 2022. Both countries showed a consistent increase of 2,000 houses each year.
Body 2
Country 4 also demonstrated a steady rise, with the number of new houses going from 55,000 in 2011 to 77,000 in 2022. In contrast, Country 3, although having the lowest initial number of new houses at 45,000 in 2011, grew to 67,000 by 2022. This country also saw a consistent annual increase of 2,000 houses, reflecting a uniform growth pattern similar to the other countries.
Bài tham khảo 2
The table illustrates the annual number of new houses built in four countries from 2011 to 2022.
Overall, the number of new houses constructed in all four countries showed a steady increase over the twelve-year period. Country 2 consistently had the highest number of new houses built each year, while Country 3 had the lowest figures throughout the given period.
In 2011, Country 2 started with the highest number of new houses built at 60,000, followed by Country 4 with 55,000, Country 1 with 50,000, and Country 3 with 45,000. By 2016, these numbers had risen to 70,000 for Country 2, 65,000 for Country 4, 60,000 for Country 1, and 55,000 for Country 3, maintaining the same ranking order.
From 2017 to 2022, the upward trend continued. By 2022, Country 2 reached 82,000 new houses built, maintaining its lead. Country 4 built 77,000 new houses, while Country 1 and Country 3 reached 72,000 and 67,000 new houses, respectively. The consistent year-on-year growth highlights the increasing demand for housing across all four countries.
Bài tham khảo 3
Introduction
The table provides data on the number of new houses built annually in four different countries from 2011 to 2022.
Overview
Overall, the number of new houses constructed each year shows an increasing trend in all four countries. Notably, Country 2 consistently had the highest number of new houses built each year, while Country 3 had the lowest numbers throughout the given period.
Body 1
Starting with Country 1, the number of new houses built annually rose steadily from 50,000 in 2011 to 72,000 in 2022. Similarly, Country 2 also saw a consistent increase, beginning at 60,000 new houses in 2011 and reaching 82,000 by 2022. This country had the highest figures every year, maintaining a lead over the other three countries.
Body 2
Country 3 and Country 4 also experienced steady growth in the number of new houses built annually. In 2011, Country 3 built 45,000 new houses, and this number increased to 67,000 by 2022. Meanwhile, Country 4 started with 55,000 new houses in 2011 and saw this number rise to 77,000 in 2022. Despite having the lowest figures, Country 3’s growth rate was comparable to the other countries, indicating a steady improvement over the years.
Bài tham khảo 4
Introduction
The table provides information on the annual number of new houses built from 2011 to 2022 in four different countries.
Overview
Overall, all four countries experienced steady growth in the number of new houses built over the surveyed period. Country 2 consistently had the highest number of new houses, while Country 3 had the lowest.
Body 1
Over the 12 years, the number of new houses built in Country 1 increased from 50,000 in 2011 to 72,000 in 2022. Similarly, Country 2 saw a corresponding increase from 60,000 to 82,000. Both countries demonstrated a stable growth rate, with an average annual increase of approximately 2,000 houses.
Body 2
Countries 3 and 4 also showed similar growth trends. Country 3 started with 45,000 houses in 2011 and ended with 67,000 houses in 2022. Country 4, starting at 55,000 houses, reached 77,000 houses over the same period. Although Country 3 had a lower number of new houses compared to the other countries, the annual increase remained consistent.
Conclusion
In summary, all four countries showed a trend of increasing numbers of new houses built each year, with Country 2 having the highest number of new houses throughout the period.


