IELTS Writing Task 1 yêu cầu mô tả biểu đồ về số lượng học sinh đạt giải Olympic quốc tế từ năm 2011 đến năm 2022 của bốn quốc gia. Bạn cần phân tích dữ liệu, so sánh xu hướng, và nhấn mạnh các điểm nổi bật. Sử dụng ngôn ngữ chính xác, mạch lạc và cấu trúc câu rõ ràng.
Bạn có thể đọc lại bài nói về Task 1 tại đây: IELTS Writing Task 1 cần lưu ý những gì?
Bạn cũng có thể đọc thêm bài viết này vì đề bài này là IELTS Writing Task 1 biểu đồ Line Graph.
Bạn cũng có thể Xây Dựng Lộ Trình Cá Nhân Hóa của mình tại link.
IELTS Writing Task 1 Line Graph: Olympic Prizes
You should spent about 20 mintutes on this task
IELTS Writing Task 1 requires describing a chart about the number of students winning international Olympic prizes from 2011 to 2022 in four countries. You need to analyze the data, compare trends, and highlight key points. Use accurate language, coherence, and clear sentence structure.
You should write at least 150 words.
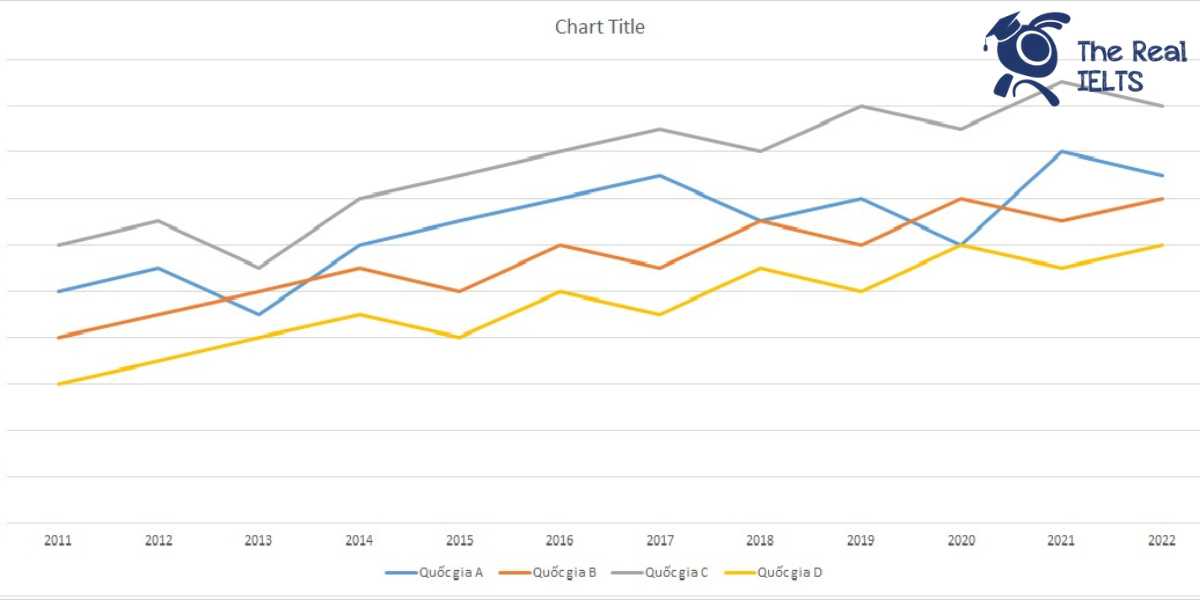
| Năm | Quốc gia A | Quốc gia B | Quốc gia C | Quốc gia D |
| 2011 | 10 | 8 | 12 | 6 |
| 2012 | 11 | 9 | 13 | 7 |
| 2013 | 9 | 10 | 11 | 8 |
| 2014 | 12 | 11 | 14 | 9 |
| 2015 | 13 | 10 | 15 | 8 |
| 2016 | 14 | 12 | 16 | 10 |
| 2017 | 15 | 11 | 17 | 9 |
| 2018 | 13 | 13 | 16 | 11 |
| 2019 | 14 | 12 | 18 | 10 |
| 2020 | 12 | 14 | 17 | 12 |
| 2021 | 16 | 13 | 19 | 11 |
| 2022 | 15 | 14 | 18 | 12 |

Bài tham khảo 1
Introduction
The table illustrates the number of students from four different countries (A, B, C, and D) who won international Olympic awards annually from 2011 to 2022.
Overview
Overall, Country C consistently had the highest number of award-winning students throughout the period, while Country D had the lowest. Both Country A and Country B showed general upward trends, though with some fluctuations.
Body 1
From 2011 to 2022, Country C saw a significant increase in its number of award-winning students, starting from 12 in 2011 and peaking at 19 in 2021. Despite a slight decline to 18 in 2022, Country C remained the leader in this regard. In comparison, Country A’s numbers also grew, starting at 10 in 2011, reaching a high of 16 in 2021, and slightly decreasing to 15 in 2022.
Body 2
Country B and Country D had more modest increases. Country B’s figures fluctuated more, starting at 8 in 2011 and ending at 14 in 2022, with several ups and downs in between. Similarly, Country D, which had the lowest starting point of 6 in 2011, showed a steady rise, peaking at 12 in both 2020 and 2022. Despite these fluctuations, both countries showed overall growth in the number of students winning international Olympic awards over the given period.
Bài tham khảo 2
The table illustrates the number of students from four countries (A, B, C, and D) who won international Olympic awards from 2011 to 2022.
Overview:
Overall, all four countries show an upward trend in the number of awards won, with Country C consistently leading and Country D generally having the fewest winners. Country A and Country B exhibit more fluctuations but also show growth over the period.
Body 1:
Country A started with 10 awards in 2011 and saw a general increase over the years, peaking at 16 awards in 2021 before slightly dropping to 15 in 2022. The number of awards for Country B began at 8 in 2011 and steadily increased, with some fluctuations, reaching 14 in both 2020 and 2022.
Body 2:
Country C had the highest number of awards each year, starting at 12 in 2011 and peaking at 19 in 2021. This country’s performance remained consistently strong, ending at 18 awards in 2022. Meanwhile, Country D had the least number of awards initially, with 6 in 2011. Despite this, there was a gradual increase, reaching 12 awards in 2020 and 2022, demonstrating steady improvement over the years.
Bài tham khảo 3
Introduction
The table provides a detailed breakdown of the number of students from four different countries who won international Olympic prizes from 2011 to 2022.
Overview
Overall, all four countries showed an upward trend in the number of students winning international Olympic prizes, with some fluctuations. Notably, Country C consistently had the highest number of winners each year, while Country D had the lowest.
Body 1
From 2011 to 2022, Country A’s number of winners increased from 10 to 15, peaking at 16 in 2021. Country B saw a steady rise, starting from 8 winners in 2011 and reaching 14 in 2022, with minor fluctuations, including peaks in 2016 and 2020.
Body 2
Country C consistently led in the number of winners, growing from 12 in 2011 to a high of 19 in 2021, then slightly dropping to 18 in 2022. Country D had the fewest winners, starting with 6 in 2011, and reaching 12 in 2020 and 2022, despite some fluctuations. This data highlights the varying degrees of success and progress in winning international Olympic prizes among the four countries.
Bài tham khảo 4
The table presents the number of students from four countries (A, B, C, and D) who won international Olympic awards from 2011 to 2022.
Overview: Overall, the data indicates an upward trend in the number of students winning awards for most countries, with Country C consistently achieving the highest numbers. Countries A and B show moderate increases, while Country D exhibits fluctuations.
Body 1: In 2011, Country C had the highest number of award-winning students (12), followed by Country A (10), Country B (8), and Country D (6). Over the years, Country C’s numbers rose steadily, peaking at 19 in 2021, and slightly decreasing to 18 in 2022. Similarly, Country A saw a rise from 10 students in 2011 to 16 in 2021, before dropping slightly to 15 in 2022.
Body 2: Country B also showed an increase, starting from 8 students in 2011 and reaching 14 students in 2022. Despite some fluctuations, Country D had the lowest figures among the four countries, starting with 6 students in 2011 and ending with 12 in 2022. Notably, Country D experienced an increase from 9 to 11 students between 2017 and 2018, indicating a brief period of improvement.
In conclusion, while Country C maintained the highest number of international Olympic award winners throughout the period, all countries demonstrated overall growth, reflecting their improving performance in international competitions.
Bài tham khảo 5
Introduction
The table presents the number of students from four countries (A, B, C, and D) who won international Olympic awards each year from 2011 to 2022.
Overview
Overall, all four countries experienced an upward trend in the number of students winning awards over the 12-year period. Country C consistently had the highest number of award-winning students, while Country D generally had the fewest.
Body 1
In 2011, Country C led with 12 award-winning students, followed by Country A with 10, Country B with 8, and Country D with 6. Over the years, Country C’s numbers increased, reaching a peak of 19 in 2021. Similarly, Country A saw a steady rise, starting from 10 in 2011 and peaking at 16 in 2021 before slightly decreasing to 15 in 2022.
Body 2
Country B and Country D showed more fluctuation. Country B began with 8 students in 2011 and saw a gradual increase, reaching 14 in 2020 and 2022. Country D, on the other hand, started with 6 students in 2011, experienced fluctuations over the years, and reached its highest number of 12 students in 2020 and 2022. Despite these variations, both countries displayed an overall upward trend.
In conclusion, the data indicates that while all four countries saw an increase in the number of students winning international Olympic awards, Country C consistently maintained the highest numbers throughout the period.