IELTS Writing Task 1 yêu cầu bạn mô tả biểu đồ về doanh số bán hàng trực tuyến hàng tháng trong năm 2019 của bốn quốc gia. Bạn cần phân tích số liệu, so sánh xu hướng và nêu bật những điểm quan trọng. Bài viết nên rõ ràng, mạch lạc và không chứa ý kiến cá nhân.
Bạn có thể đọc lại bài nói về Task 1 tại đây: IELTS Writing Task 1 cần lưu ý những gì?
Bạn cũng có thể đọc thêm bài viết này vì đề bài này là IELTS Writing Task 1 biểu đồ Line Graph.
IELTS Writing Task 1 Line Graph: Online Sales
You should spent about 20 mintutes on this task
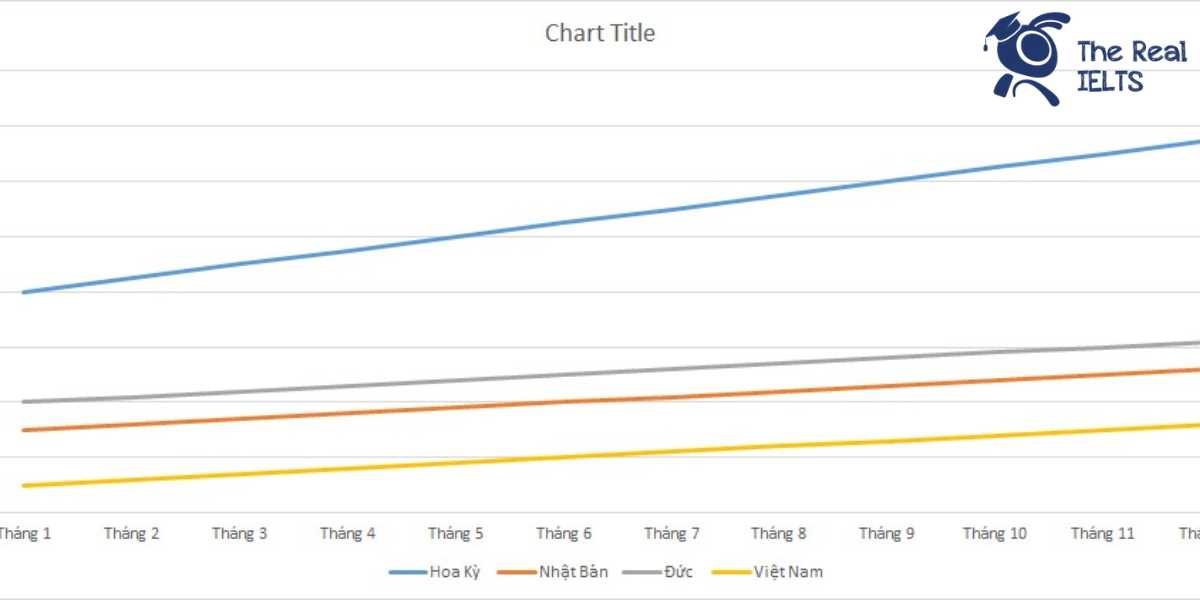
IELTS Writing Task 1 requires you to describe a chart about the monthly online sales in 2019 of four countries. You need to analyze the data, compare trends, and highlight significant points. The essay should be clear, coherent, and free of personal opinions.
You should write at least 150 words.
| Tháng | Hoa Kỳ | Nhật Bản | Đức | Việt Nam |
| Tháng 1 | 80 | 30 | 40 | 10 |
| Tháng 2 | 85 | 32 | 42 | 12 |
| Tháng 3 | 90 | 34 | 44 | 14 |
| Tháng 4 | 95 | 36 | 46 | 16 |
| Tháng 5 | 100 | 38 | 48 | 18 |
| Tháng 6 | 105 | 40 | 50 | 20 |
| Tháng 7 | 110 | 42 | 52 | 22 |
| Tháng 8 | 115 | 44 | 54 | 24 |
| Tháng 9 | 120 | 46 | 56 | 26 |
| Tháng 10 | 125 | 48 | 58 | 28 |
| Tháng 11 | 130 | 50 | 60 | 30 |
| Tháng 12 | 135 | 52 | 62 | 32 |

Bài tham khảo 1
Introduction: The line graph illustrates the monthly online sales figures of four countries (the USA, Japan, Germany, and Vietnam) in 2019. The sales are represented in millions of USD.
Overview: Overall, it is evident that the online sales in all four countries showed a consistent upward trend throughout the year. The USA had the highest sales figures, while Vietnam had the lowest. However, all countries experienced growth in their online sales from January to December.
Body 1: In January, the USA had the highest online sales at 80 million USD, followed by Germany at 40 million USD, Japan at 30 million USD, and Vietnam at 10 million USD. By mid-year (June), sales in the USA had increased to 105 million USD, Japan to 40 million USD, Germany to 50 million USD, and Vietnam to 20 million USD. This steady growth continued throughout the first half of the year for all countries.
Body 2: In the latter half of the year, the upward trend persisted. By December, the USA reached the peak with 135 million USD, followed by Germany at 62 million USD, Japan at 52 million USD, and Vietnam at 32 million USD. The USA consistently led the online sales figures, while Vietnam, despite having the lowest sales, showed significant growth over the year, ending with a threefold increase from January.
Overall, all four countries demonstrated substantial increases in online sales, with the USA maintaining a dominant position throughout 2019.
Bài tham khảo 2
Introduction:
The line graph illustrates the monthly online sales figures (in million USD) for four countries, namely the USA, Japan, Germany, and Vietnam, over the course of 2019.
Overview:
Overall, the USA consistently had the highest online sales throughout the year, while Vietnam had the lowest. However, all four countries showed a steady increase in their online sales figures from January to December.
Body 1:
Starting with the USA, the online sales began at 80 million USD in January and experienced a continuous rise each month, reaching 135 million USD by December. This steady growth indicates a significant increase in online consumer activity over the year.
Japan and Germany followed a similar upward trend, though their sales figures were lower than those of the USA. Japan’s sales started at 30 million USD in January and climbed to 52 million USD by December. Germany’s figures were slightly higher than Japan’s, beginning at 40 million USD in January and rising to 62 million USD in December.
Body 2:
Vietnam, while having the lowest sales figures among the four countries, also demonstrated a consistent increase throughout the year. Starting at 10 million USD in January, Vietnam’s online sales gradually rose to 32 million USD by December.
In conclusion, despite the varying initial sales figures, all four countries showed a similar pattern of steady growth in their online sales over the year 2019, with the USA leading by a significant margin.
Bài tham khảo 3
Introduction: The line graph illustrates the monthly online sales revenue in 2019 for four countries: the United States, Japan, Germany, and Vietnam, measured in millions of USD.
Overview: Overall, the United States consistently had the highest online sales throughout the year, while Vietnam had the lowest. All four countries showed a steady increase in online sales over the 12 months.
Body 1: In January, the United States began with the highest sales at 80 million USD, followed by Germany at 40 million USD, Japan at 30 million USD, and Vietnam at 10 million USD. As the months progressed, the United States saw a continuous rise, reaching 135 million USD in December. Similarly, Japan’s online sales started at 30 million USD and grew steadily to 52 million USD by the end of the year.
Body 2: Germany and Vietnam also experienced upward trends in their online sales. Germany started at 40 million USD in January and climbed to 62 million USD by December. Vietnam, although starting with the lowest sales figures at 10 million USD in January, also saw a consistent increase, reaching 32 million USD in December. Despite the lower figures compared to the other countries, Vietnam’s growth rate was notably steady throughout the year.