IELTS Writing Task 1 yêu cầu bạn mô tả biểu đồ điểm trung bình các môn học qua các kỳ thi của bốn quốc gia từ năm 2013. Bạn cần phân tích, so sánh dữ liệu và rút ra kết luận quan trọng. Hãy chú ý đến các xu hướng, điểm cao/thấp nhất và sự biến động theo thời gian.
Bạn có thể đọc lại bài nói về Task 1 tại đây: IELTS Writing Task 1 cần lưu ý những gì?
Bạn cũng có thể đọc thêm bài viết này vì đề bài này là IELTS Writing Task 1 biểu đồ Line Graph.
IELTS Writing Task 1 Line Graph: Average Exam Scores
You should spent about 20 mintutes on this task
IELTS Writing Task 1 requires you to describe a chart of average exam scores in various subjects for four countries since 2013. You need to analyze, compare the data, and draw significant conclusions. Pay attention to trends, highest/lowest scores, and fluctuations over time.
You should write at least 150 words.
| Năm | Quốc gia A | Quốc gia B | Quốc gia C | Quốc gia D |
| 2013 | 75 | 78 | 72 | 70 |
| 2014 | 76 | 79 | 73 | 71 |
| 2015 | 77 | 80 | 74 | 72 |
| 2016 | 78 | 81 | 75 | 73 |
| 2017 | 79 | 82 | 76 | 74 |
| 2018 | 80 | 83 | 77 | 75 |
| 2019 | 81 | 84 | 78 | 76 |
| 2020 | 82 | 85 | 79 | 77 |
| 2021 | 83 | 86 | 80 | 78 |
| 2022 | 84 | 87 | 81 | 79 |
| 2023 | 85 | 88 | 82 | 80 |

Bài tham khảo 1
Introduction
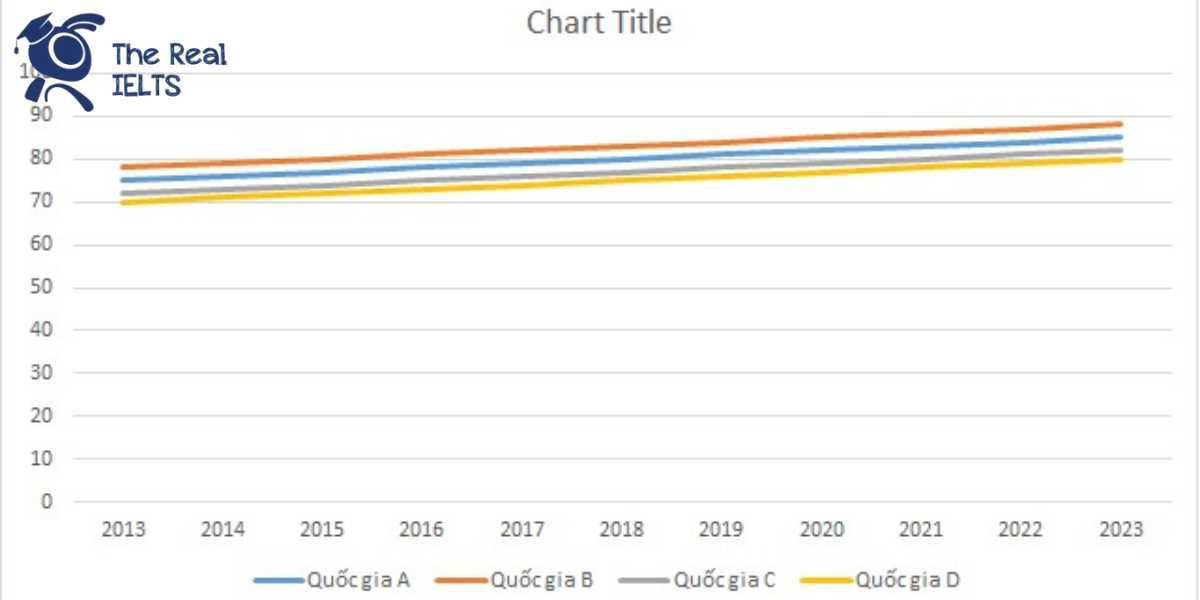
The line graph illustrates the average scores in various subjects over multiple examinations from 2013 to 2023 in four countries: Country A, Country B, Country C, and Country D.
Overview
Overall, all four countries experienced a steady increase in their average scores over the given period. Country B consistently had the highest average scores, while Country D had the lowest, although the gaps between the countries slightly narrowed over time.
Body 1
In 2013, Country B began with the highest average score of 78, followed by Country A with 75, Country C with 72, and Country D with 70. From 2013 to 2023, Country B showed a consistent rise in scores, reaching 88 in 2023, maintaining its top position throughout the period. Similarly, Country A’s scores also increased steadily from 75 in 2013 to 85 in 2023, maintaining its second position.
Body 2
Country C and Country D followed similar upward trends but with lower scores compared to Countries A and B. Country C’s average scores increased from 72 in 2013 to 82 in 2023, while Country D’s scores rose from 70 to 80 over the same period. Despite starting with the lowest scores, Country D managed to close the gap slightly with the other countries by 2023, although it remained in the last position.
Conclusion
In conclusion, all four countries showed notable improvements in their average scores over the examined period, with Country B consistently outperforming the others and Country D showing the slowest but steady growth.
Bài tham khảo 2
The line graph illustrates the annual university graduation rates in four countries—Country A, Country B, Country C, and Country D—from 2013 to 2023.
Overall, all four countries show a steady increase in graduation rates over the ten-year period. Country B consistently has the highest graduation rates, while Country D remains the lowest throughout the period.
In 2013, Country B started with the highest graduation rate at 30%, followed by Country C at 28%, Country A at 25%, and Country D at 22%. Over the next decade, all four countries experienced a gradual rise in their graduation rates. By 2018, Country B reached 35%, while Country C and Country A followed with 33% and 30%, respectively. Country D remained the lowest at 27%.
Between 2019 and 2023, the upward trend continued. By 2023, Country B peaked at 40%, maintaining its lead. Country C and Country A also showed significant growth, reaching 38% and 35%, respectively. Country D, despite having the lowest rates, saw a consistent increase, culminating at 32% in 2023.
In summary, the data shows a consistent upward trajectory in university graduation rates across all four countries, with Country B maintaining the highest rates throughout the period, and Country D showing the lowest but steady growth.
Bài tham khảo 3
The line graph illustrates the average scores in various subjects across different examination periods for four countries: A, B, C, and D from 2013 to 2023.
Overall, the data reveals a consistent upward trend in average scores for all four countries over the given period. Country B consistently had the highest average scores, while Country D had the lowest, with all countries showing steady improvements each year.
In the initial year of 2013, Country B led with an average score of 78, followed by Country A at 75, Country C at 72, and Country D at 70. By 2018, the scores had increased for all countries, with Country B still on top at 83, Country A at 80, Country C at 77, and Country D at 75. This pattern of gradual increase continued throughout the years.
By 2023, the average scores had risen significantly, with Country B reaching 88, Country A at 85, Country C at 82, and Country D at 80. Throughout the decade, the scores for each country increased by approximately 10 points, highlighting a consistent improvement in academic performance across all four countries.
In conclusion, the line graph demonstrates that while all four countries have improved their average scores in various subjects over the years, Country B has maintained its position as the top performer, and Country D, despite being the lowest, has shown steady progress.