IELTS Writing Task 1 yêu cầu mô tả biểu đồ về tỷ lệ sử dụng smartphone theo bốn độ tuổi từ năm 2010 đến 2022. Người viết cần phân tích và so sánh xu hướng sử dụng của các nhóm tuổi khác nhau qua các năm, chỉ ra những thay đổi đáng chú ý và rút ra kết luận chính.
Bạn có thể đọc lại bài nói về Task 1 tại đây: IELTS Writing Task 1 cần lưu ý những gì?
Bạn cũng có thể đọc thêm bài viết này vì đề bài này là IELTS Writing Task 1 biểu đồ Line Graph.
Bạn cũng có thể Xây Dựng Lộ Trình Cá Nhân Hóa của mình tại link.
IELTS Writing Task 1 Line Graph: Smartphone Usage
You should spent about 20 mintutes on this task
IELTS Writing Task 1 requires describing a chart about the rate of smartphone usage by four age groups from 2010 to 2022. The writer needs to analyze and compare the usage trends of different age groups over the years, highlight notable changes, and draw main conclusions.
You should write at least 150 words.
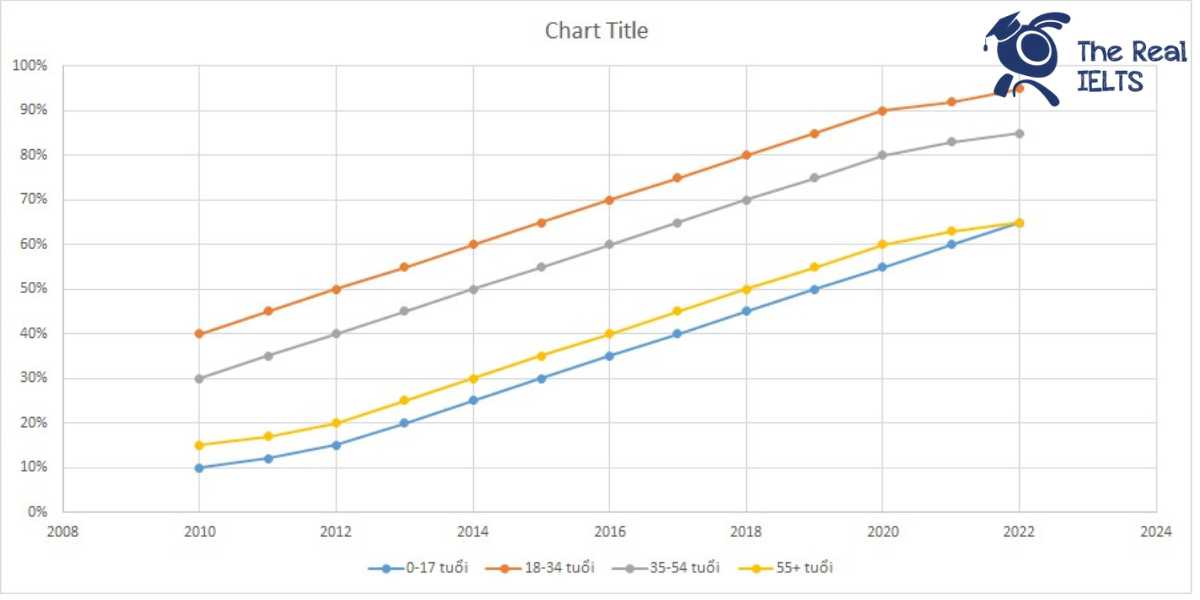
| Năm | 0-17 tuổi | 18-34 tuổi | 35-54 tuổi | 55+ tuổi |
| 2010 | 10% | 40% | 30% | 15% |
| 2011 | 12% | 45% | 35% | 17% |
| 2012 | 15% | 50% | 40% | 20% |
| 2013 | 20% | 55% | 45% | 25% |
| 2014 | 25% | 60% | 50% | 30% |
| 2015 | 30% | 65% | 55% | 35% |
| 2016 | 35% | 70% | 60% | 40% |
| 2017 | 40% | 75% | 65% | 45% |
| 2018 | 45% | 80% | 70% | 50% |
| 2019 | 50% | 85% | 75% | 55% |
| 2020 | 55% | 90% | 80% | 60% |
| 2021 | 60% | 92% | 83% | 63% |
| 2022 | 65% | 95% | 85% | 65% |

Bài tham khảo 1
Introduction
The table provides data on the percentage of smartphone usage among four different age groups from 2010 to 2022. The age groups are 0-17 years, 18-34 years, 35-54 years, and 55+ years.
Overview
Overall, the trend indicates a significant increase in smartphone usage across all age groups over the period. The 18-34 age group consistently had the highest percentage of smartphone usage, while the 0-17 and 55+ age groups saw the most substantial growth rates.
Body 1
In 2010, the percentage of smartphone usage was relatively low in all age groups, with the 18-34 age group leading at 40%. By 2014, this group reached 60%, marking a 20% increase. Similarly, the 35-54 age group saw a rise from 30% in 2010 to 50% in 2014. The younger group, aged 0-17, experienced a moderate increase from 10% to 25% over the same period. The 55+ age group, initially at 15%, grew to 30% by 2014.
Body 2
From 2015 onwards, the upward trend continued, with the 18-34 age group reaching a peak of 95% by 2022. The 35-54 age group also saw substantial growth, reaching 85% by 2022. Notably, the 0-17 age group experienced the most rapid increase, climbing to 65% by 2022. The 55+ age group, although starting from a lower base, saw a consistent rise, reaching 65% in the same year. This data highlights the broadening acceptance and integration of smartphone technology across all age demographics over the 12-year period.
Bài tham khảo 2
Introduction
The table presents data on the percentage of smartphone usage across four different age groups (0-17, 18-34, 35-54, and 55+) from 2010 to 2022.
Overview
Overall, the table shows a significant increase in smartphone usage among all age groups over the period. The 18-34 age group consistently had the highest percentage of smartphone usage, while the 0-17 age group exhibited the most rapid growth rate.
Body 1
In 2010, smartphone usage was highest among the 18-34 age group at 40%, followed by the 35-54 age group at 30%. The 55+ age group had a usage rate of 15%, and the 0-17 age group had the lowest at 10%. By 2012, usage had increased across all groups, with the 18-34 age group reaching 50%, the 35-54 age group at 40%, the 55+ age group at 20%, and the 0-17 age group at 15%.
Body 2
The trend of increasing smartphone usage continued over the years. By 2016, the 18-34 age group had risen to 70%, while the 35-54 age group reached 60%. The 0-17 and 55+ age groups showed notable growth, with usage rates at 35% and 40%, respectively. In 2022, the 18-34 age group peaked at 95%, the 35-54 age group at 85%, the 0-17 age group at 65%, and the 55+ age group at 65%, indicating a broad and significant adoption of smartphones across all age groups.
Bài tham khảo 3
The table illustrates the percentage of smartphone usage across four different age groups (0-17, 18-34, 35-54, and 55+) from 2010 to 2022.
Overview:
Overall, the data reveals a steady increase in smartphone usage among all age groups over the period. The 18-34 age group consistently had the highest usage rates, while the 0-17 and 55+ age groups had the lowest but showed significant growth.
Body 1:
In 2010, the percentage of smartphone users was lowest among the 0-17 age group at 10%, followed by the 55+ age group at 15%. The 18-34 age group had the highest usage at 40%, while the 35-54 age group stood at 30%. Over the next few years, there was a noticeable upward trend in smartphone usage across all age groups. By 2014, the 0-17 age group reached 25%, the 18-34 age group hit 60%, the 35-54 age group increased to 50%, and the 55+ age group rose to 30%.
Body 2:
From 2015 to 2022, the increase continued steadily. The 0-17 age group saw its usage rise from 30% in 2015 to 65% in 2022. The 18-34 age group, which had the highest initial percentage, climbed to 95% by 2022. The 35-54 age group also showed significant growth, reaching 85% in 2022. Meanwhile, the 55+ age group, although starting with the lowest percentages, increased to 65% by the end of the period. This data indicates a broad and consistent rise in smartphone adoption across all age demographics over the 12-year span.
Bài tham khảo 4
Introduction:
The table illustrates the percentage of smartphone usage across four different age groups (0-17, 18-34, 35-54, and 55+) from 2010 to 2022.
Overview:
Overall, the data reveals an upward trend in smartphone usage across all age groups throughout the period. The 18-34 age group consistently had the highest percentage of smartphone users, while the 55+ age group experienced the most significant growth.
Body 1:
In 2010, the 18-34 age group led with 40% smartphone usage, followed by the 35-54 group at 30%, the 55+ group at 15%, and the 0-17 group at 10%. By 2015, these figures had increased to 65%, 55%, 35%, and 30%, respectively. The 18-34 age group saw the most substantial increase, reaching 95% by 2022. Meanwhile, the 35-54 group rose to 85%, and the 0-17 group climbed to 65%.
Body 2:
The 55+ age group, starting at just 15% in 2010, experienced the most dramatic increase, reaching 65% by 2022. This indicates a growing acceptance of technology among older adults. Additionally, the steady rise in the 0-17 age group highlights the increasing exposure of younger generations to smartphones. Overall, the data underscores the widespread and growing adoption of smartphones across all age demographics over the 12-year span.