IELTS Writing Task 1 yêu cầu bạn mô tả biểu đồ về số lượng người dùng mạng xã hội hàng tháng từ năm 2011 đến 2022 tại bốn quốc gia. Bạn cần phân tích và so sánh dữ liệu, chỉ ra xu hướng tăng hoặc giảm, và nêu bật các điểm đáng chú ý trong biểu đồ một cách rõ ràng và logic.
Bạn có thể đọc lại bài nói về Task 1 tại đây: IELTS Writing Task 1 cần lưu ý những gì?
Bạn cũng có thể đọc thêm bài viết này vì đề bài này là IELTS Writing Task 1 biểu đồ Line Graph.
Bạn cũng có thể Xây Dựng Lộ Trình Cá Nhân Hóa của mình tại link.
IELTS Writing Task 1 Line Graph: Social Media
You should spent about 20 mintutes on this task
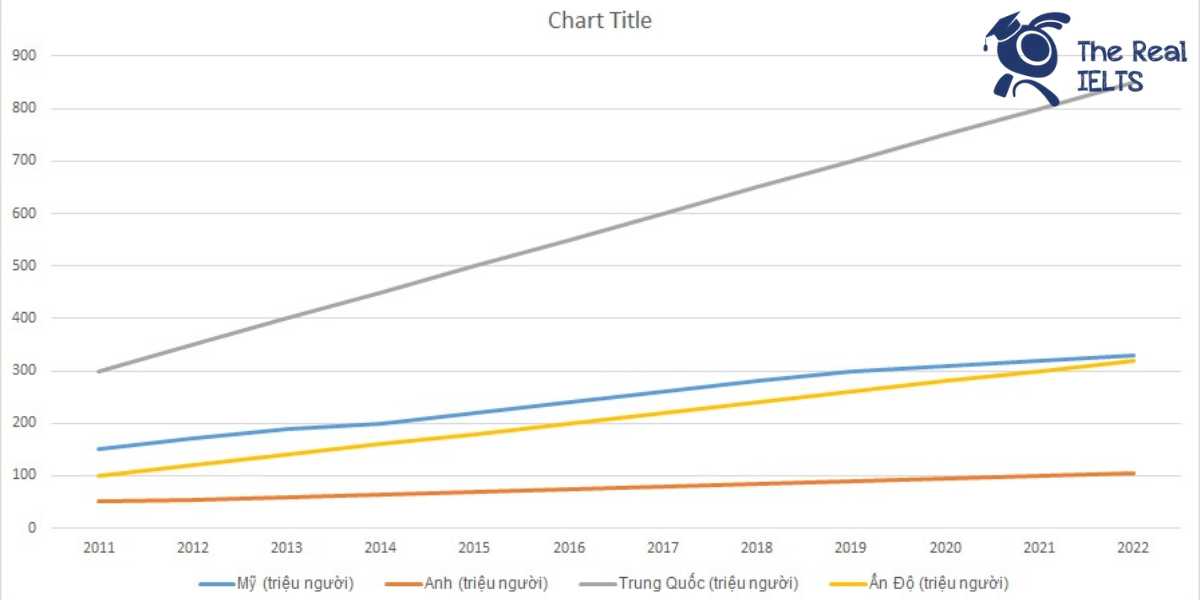
IELTS Writing Task 1 requires you to describe a chart showing the number of monthly social media users from 2011 to 2022 in four countries. You need to analyze and compare the data, identify trends of increase or decrease, and highlight notable points in the chart clearly and logically.
You should write at least 150 words.
| Năm | Mỹ (triệu người) | Anh (triệu người) | Trung Quốc (triệu người) | Ấn Độ (triệu người) |
| 2011 | 150 | 50 | 300 | 100 |
| 2012 | 170 | 55 | 350 | 120 |
| 2013 | 190 | 60 | 400 | 140 |
| 2014 | 200 | 65 | 450 | 160 |
| 2015 | 220 | 70 | 500 | 180 |
| 2016 | 240 | 75 | 550 | 200 |
| 2017 | 260 | 80 | 600 | 220 |
| 2018 | 280 | 85 | 650 | 240 |
| 2019 | 300 | 90 | 700 | 260 |
| 2020 | 310 | 95 | 750 | 280 |
| 2021 | 320 | 100 | 800 | 300 |
| 2022 | 330 | 105 | 850 | 320 |

Bài tham khảo 1
The line graph illustrates the monthly number of social media users in four countries— the USA, the UK, China, and India— from 2011 to 2022.
Overall, there was a steady increase in the number of social media users in all four countries over the given period. China consistently had the highest number of users, while the UK had the lowest. Both India and the USA showed significant growth, with India experiencing the most rapid increase.
In the USA, the number of social media users rose from 150 million in 2011 to 330 million in 2022, showing a continuous upward trend. Similarly, the UK saw a gradual increase from 50 million users in 2011 to 105 million in 2022. This steady growth in both countries reflects the increasing popularity and accessibility of social media.
China, which started with 300 million users in 2011, experienced a sharp rise to 850 million by 2022, maintaining its position as the country with the largest number of social media users throughout the period. India, starting with 100 million users in 2011, saw the most dramatic increase, reaching 320 million in 2022. This rapid growth is indicative of the expanding digital infrastructure and rising internet penetration in India.
In conclusion, while all four countries saw substantial growth in social media usage, China and India demonstrated the most significant increases. The USA and the UK, though growing steadily, had lower user numbers compared to China and India by the end of the period.
Bài tham khảo 2
Introduction: The line graph illustrates the number of monthly social media users in four countries: the USA, the UK, China, and India, from 2011 to 2022.
Overview: Overall, the number of social media users in all four countries exhibited a continuous upward trend throughout the period. China consistently had the highest number of users, followed by the USA, India, and the UK.
Body 1: In 2011, China led with 300 million users, significantly higher than the USA, which had 150 million users. India and the UK had considerably lower figures, with 100 million and 50 million users respectively. Over the next few years, China experienced rapid growth, reaching 500 million users by 2015 and further skyrocketing to 850 million by 2022. Similarly, the USA saw a substantial increase, climbing from 150 million in 2011 to 330 million by 2022.
Body 2: India also showed a remarkable rise in social media users, growing from 100 million in 2011 to 320 million in 2022. The UK, while having the smallest user base among the four countries, also saw consistent growth, from 50 million users in 2011 to 105 million in 2022. Notably, the growth rates in China and India were more pronounced compared to the USA and the UK, highlighting the significant expansion of social media usage in these populous countries.
Bài tham khảo 3
Introduction
The table illustrates the monthly number of social media users, in millions, in the USA, UK, China, and India from 2011 to 2022.
Overview
Overall, the number of social media users increased steadily in all four countries over the period. China had the highest number of users throughout, followed by the USA, India, and the UK.
Body 1
In 2011, the USA had 150 million social media users, which rose to 330 million by 2022. The UK started with 50 million users in 2011 and saw an increase to 105 million in 2022. This growth in social media usage reflects the rising popularity and accessibility of social networks in these Western countries.
Body 2
China had the highest number of social media users in 2011 with 300 million, reaching 850 million by 2022, a substantial increase. India’s social media users grew from 100 million in 2011 to 320 million in 2022. Both countries experienced significant growth, highlighting the rapid digital adoption in these populous nations.
Bài tham khảo 4
Introduction
The line graph illustrates the number of monthly social media users in four countries: the United States, the United Kingdom, China, and India, from 2011 to 2022.
Overview
Overall, all four countries experienced a significant increase in the number of social media users over the period. China consistently had the highest number of users, while the UK had the lowest. The growth trend was steady for all countries, with notable increases in user numbers each year.
Body 1
In 2011, China led with 300 million social media users, followed by the United States with 150 million, India with 100 million, and the UK with 50 million. Over the years, China’s user base grew significantly, reaching 850 million by 2022. The United States also saw a substantial rise, with the number of users increasing from 150 million in 2011 to 330 million in 2022.
Body 2
India’s growth trajectory was similar to that of the United States, with the number of social media users rising from 100 million in 2011 to 320 million in 2022. The UK, despite having the lowest user base, also experienced consistent growth, increasing from 50 million users in 2011 to 105 million in 2022. The data indicate a clear upward trend in social media usage across all four countries, reflecting the global rise in social media adoption.