IELTS Writing Task 1 yêu cầu phân tích biểu đồ doanh số bán hàng hàng tháng của các siêu thị trong năm 2021 tại bốn quốc gia. Bài viết cần so sánh số liệu, nêu bật xu hướng chính, điểm tương đồng và khác biệt, đồng thời cung cấp cái nhìn tổng quan về sự biến động doanh số trong năm.
Bạn có thể đọc lại bài nói về Task 1 tại đây: IELTS Writing Task 1 cần lưu ý những gì?
Bạn cũng có thể đọc thêm bài viết này vì đề bài này là IELTS Writing Task 1 biểu đồ Line Graph.
Bạn cũng có thể Xây Dựng Lộ Trình Cá Nhân Hóa của mình tại link.
IELTS Writing Task 1 Line Graph: Supermarkets
You should spent about 20 mintutes on this task
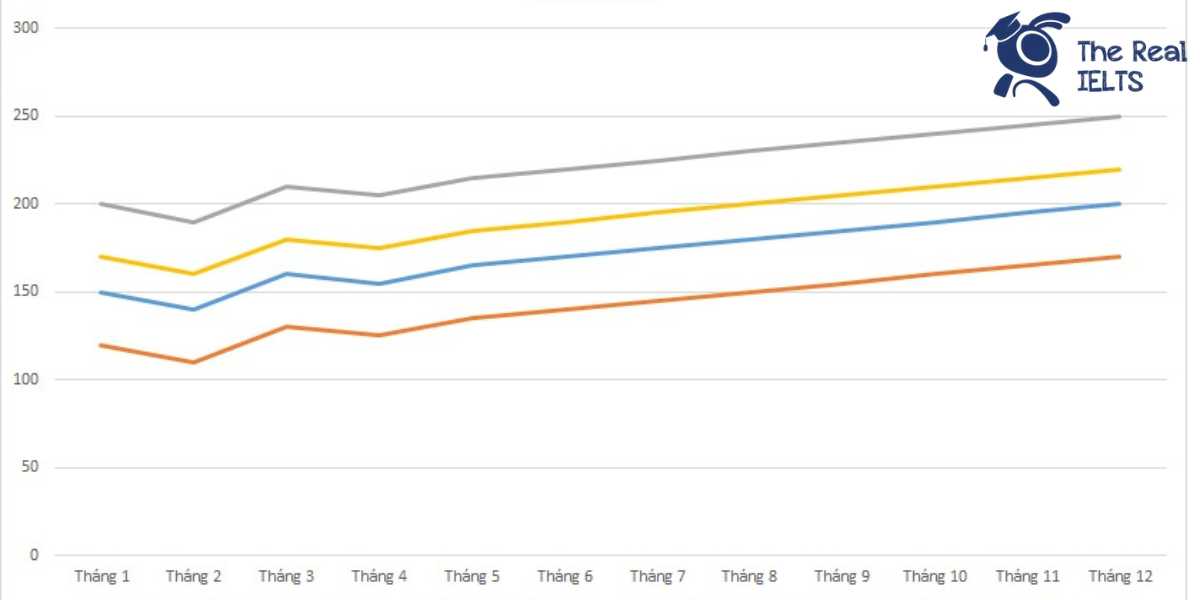
IELTS Writing Task 1 requires analyzing the monthly sales chart of supermarkets in four countries for the year 2021. The task involves comparing figures, highlighting key trends, similarities, and differences, as well as providing an overview of sales fluctuations throughout the year.
You should write at least 150 words.
| Tháng | Quốc gia A (Triệu USD) | Quốc gia B (Triệu USD) | Quốc gia C (Triệu USD) | Quốc gia D (Triệu USD) |
| Tháng 1 | 150,000 | 120,000 | 200,000 | 170,000 |
| Tháng 2 | 140,000 | 110,000 | 190,000 | 160,000 |
| Tháng 3 | 160,000 | 130,000 | 210,000 | 180,000 |
| Tháng 4 | 155,000 | 125,000 | 205,000 | 175,000 |
| Tháng 5 | 165,000 | 135,000 | 215,000 | 185,000 |
| Tháng 6 | 170,000 | 140,000 | 220,000 | 190,000 |
| Tháng 7 | 175,000 | 145,000 | 225,000 | 195,000 |
| Tháng 8 | 180,000 | 150,000 | 230,000 | 200,000 |
| Tháng 9 | 185,000 | 155,000 | 235,000 | 205,000 |
| Tháng 10 | 190,000 | 160,000 | 240,000 | 210,000 |
| Tháng 11 | 195,000 | 165,000 | 245,000 | 215,000 |
| Tháng 12 | 200,000 | 170,000 | 250,000 | 220,000 |

Bài tham khảo 1
The table provides a monthly breakdown of supermarket sales in four countries (A, B, C, and D) for the year 2021, measured in million USD.
Overall, it is evident that sales in all four countries showed a consistent upward trend throughout the year. Among the countries, Country C had the highest sales figures each month, while Country B had the lowest.
In the first half of the year, Country C led the sales figures, starting from 200 million USD in January and increasing steadily to 220 million USD by June. Country A followed, beginning at 150 million USD in January and rising to 170 million USD in June. Country D’s sales also grew from 170 million USD to 190 million USD over the same period, whereas Country B saw an increase from 120 million USD to 140 million USD.
In the second half of the year, the trend continued with all countries experiencing growth. By December, Country C’s sales had reached 250 million USD, maintaining its top position. Country A ended the year with 200 million USD, and Country D with 220 million USD. Country B, despite being the lowest, showed growth, closing the year at 170 million USD.
In summary, the data indicates a steady increase in supermarket sales across all four countries, with Country C consistently having the highest sales and Country B the lowest.
Bài tham khảo 2
Introduction
The table illustrates the monthly sales revenue of supermarkets in four different countries (Country A, Country B, Country C, and Country D) throughout the year 2021. The figures are presented in million USD.
Overview
Overall, it is evident that sales in all four countries show a general upward trend over the year. Among the four countries, Country C consistently has the highest sales figures each month, whereas Country B has the lowest.
Body 1
Starting with Country A, sales began at 150 million USD in January and gradually increased each month, reaching 200 million USD by December. Similarly, Country B experienced a steady rise from 120 million USD in January to 170 million USD in December. Although Country B had the lowest sales figures, it showed consistent growth over the year.
Body 2
In comparison, Country C showed the highest sales figures throughout the year, starting at 200 million USD in January and ending at 250 million USD in December. Country D also demonstrated a positive trend, with sales rising from 170 million USD in January to 220 million USD in December. Notably, the sales differences between these two countries remained relatively stable, with Country C maintaining a lead over Country D each month.
In conclusion, the sales revenues for supermarkets in all four countries increased progressively over the year 2021, with Country C achieving the highest sales and Country B the lowest.
Bài tham khảo 3
Introduction
The table provides a detailed breakdown of monthly supermarket sales in four different countries (A, B, C, and D) throughout the year 2021, measured in million USD.
Overview
Overall, sales figures in all four countries exhibited a consistent upward trend from January to December. Among the countries, Country C consistently achieved the highest monthly sales, while Country B recorded the lowest figures each month.
Body 1
In the first half of the year, Country C led the sales figures, starting with 200 million USD in January and gradually increasing to 220 million USD by June. Country D followed closely, with sales starting at 170 million USD in January and reaching 190 million USD in June. Country A’s sales also showed a steady rise, starting at 150 million USD in January and increasing to 170 million USD by June. Country B, although having the lowest sales, showed a consistent increase from 120 million USD in January to 140 million USD in June.
Body 2
The second half of the year saw a continued increase in sales across all four countries. By December, Country C’s sales peaked at 250 million USD, maintaining its lead. Country D followed with 220 million USD, while Country A reached 200 million USD. Country B, despite being the lowest, still saw a significant rise, ending the year with 170 million USD in sales. This consistent growth pattern highlights the strong performance and steady increase in supermarket sales across all four countries throughout 2021.
Bài tham khảo 4
Introduction
The table provides information on the monthly supermarket sales figures (in million USD) for four countries (Country A, Country B, Country C, and Country D) throughout the year 2021.
Overview
Overall, supermarket sales in all four countries exhibited a general upward trend over the year. Country C consistently had the highest sales figures, while Country B had the lowest. Notably, Country A and Country D showed significant growth in sales towards the end of the year.
Body 1
In January, Country C led with $200 million in sales, followed by Country D at $170 million, Country A at $150 million, and Country B at $120 million. By mid-year, in June, Country C’s sales had increased to $220 million, while Country D’s sales rose to $190 million. Country A and Country B also saw increases, reaching $170 million and $140 million, respectively.
Body 2
From July to December, the upward trend continued across all countries. By December, Country C reached the highest sales figure of $250 million. Country D’s sales grew steadily to $220 million. Country A experienced a significant rise, finishing the year at $200 million, while Country B saw a steady increase, ending at $170 million. This consistent growth throughout the year highlights the robust sales performance of supermarkets in all four countries.
Bài tham khảo 5
Introduction:
The table illustrates the monthly sales figures of supermarkets in four countries (A, B, C, and D) throughout the year 2021, with the amounts reported in million USD.
Overview:
Overall, all four countries experienced a steady increase in supermarket sales over the twelve months. Notably, Country C consistently had the highest sales figures, while Country B recorded the lowest sales figures throughout the year.
Body 1:
In the initial months, January saw Country C leading with $200 million in sales, followed by Country D with $170 million, Country A with $150 million, and Country B with $120 million. The trend of Country C having the highest sales continued through the year, reaching a peak of $250 million in December. Country D followed a similar upward trajectory, starting from $170 million in January and reaching $220 million by December.
Body 2:
Countries A and B also demonstrated an upward trend in their sales, although at a relatively slower rate compared to Countries C and D. Country A’s sales began at $150 million in January, gradually increasing to $200 million by December. Similarly, Country B’s sales figures rose from $120 million in January to $170 million in December. Despite the steady growth, Country B consistently had the lowest sales figures among the four countries each month.
In summary, the data indicates a general increase in supermarket sales across all four countries throughout 2021, with Country C maintaining the highest sales figures and Country B the lowest.