IELTS Writing Task 1 yêu cầu mô tả biểu đồ nhiệt độ trung bình hàng tháng của bốn thành phố trong năm 2021. Thí sinh phải so sánh và đối chiếu sự thay đổi nhiệt độ giữa các thành phố này, nhận xét về xu hướng chung và những điểm khác biệt nổi bật. Trình bày rõ ràng và súc tích là rất quan trọng.
Bạn có thể đọc lại bài nói về Task 1 tại đây: IELTS Writing Task 1 cần lưu ý những gì?
Bạn cũng có thể đọc thêm bài viết này vì đề bài này là IELTS Writing Task 1 biểu đồ Line Graph.
IELTS Writing Task 1 Line Graph: Monthly Temperatures
You should spent about 20 mintutes on this task
IELTS Writing Task 1 requires describing a chart of the monthly average temperatures of four cities in the year 2021. Candidates must compare and contrast the temperature changes among these cities, comment on general trends, and highlight significant differences. Clear and concise presentation is very important.
You should write at least 150 words.
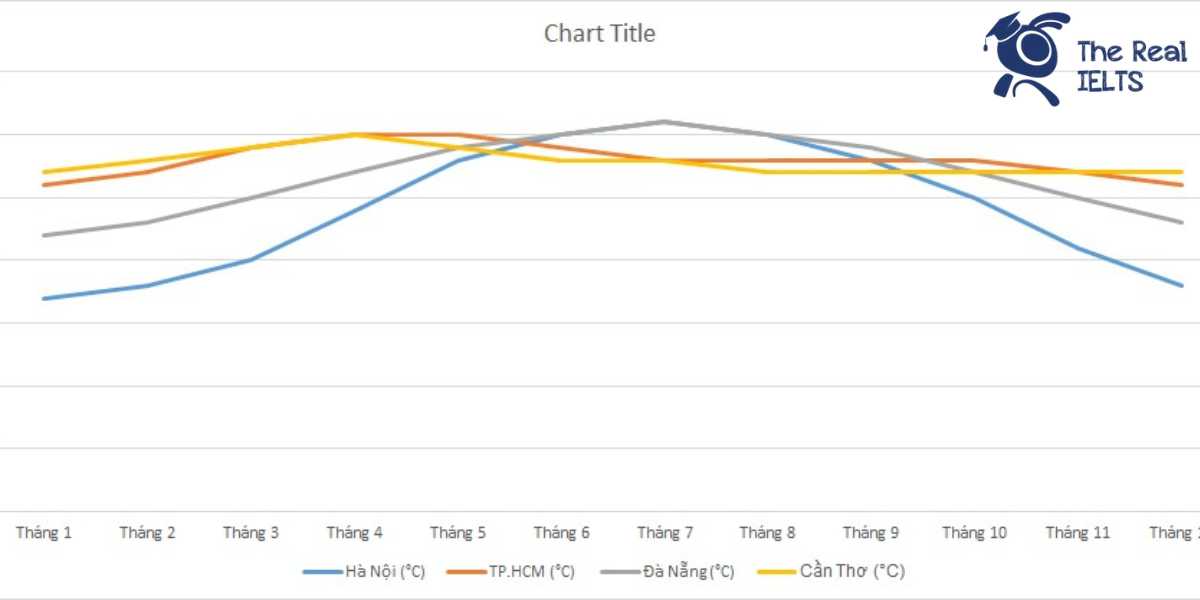
| Tháng | Hà Nội (°C) | TP.HCM (°C) | Đà Nẵng (°C) | Cần Thơ (°C) |
| Tháng 1 | 17 | 26 | 22 | 27 |
| Tháng 2 | 18 | 27 | 23 | 28 |
| Tháng 3 | 20 | 29 | 25 | 29 |
| Tháng 4 | 24 | 30 | 27 | 30 |
| Tháng 5 | 28 | 30 | 29 | 29 |
| Tháng 6 | 30 | 29 | 30 | 28 |
| Tháng 7 | 31 | 28 | 31 | 28 |
| Tháng 8 | 30 | 28 | 30 | 27 |
| Tháng 9 | 28 | 28 | 29 | 27 |
| Tháng 10 | 25 | 28 | 27 | 27 |
| Tháng 11 | 21 | 27 | 25 | 27 |
| Tháng 12 | 18 | 26 | 23 | 27 |

Bài tham khảo 1
Introduction: The line graph illustrates the average monthly temperatures in 2021 for four cities in Vietnam: Hanoi, Ho Chi Minh City (HCMC), Da Nang, and Can Tho.
Overview: Overall, the temperature patterns vary significantly among the four cities. Hanoi exhibits a distinct seasonal variation with colder winters and hotter summers, whereas HCMC, Da Nang, and Can Tho maintain relatively higher and more stable temperatures throughout the year.
Body 1: In Hanoi, temperatures start at a low of 17°C in January and gradually increase to peak at 31°C in July before declining to 18°C in December. This indicates a clear seasonal trend with the highest temperatures in the summer months and the lowest in winter. HCMC, on the other hand, shows a smaller range of temperature fluctuation, starting at 26°C in January, peaking at 30°C in April and May, and then slightly dropping to 26°C again by December.
Body 2: Da Nang and Can Tho exhibit similar temperature trends to HCMC. Da Nang’s temperatures range from 22°C in January to a peak of 31°C in July. Can Tho maintains relatively high temperatures throughout the year, fluctuating between 27°C and 30°C, with minimal variation. Notably, the temperatures in Can Tho remain constant at 27°C from October to December, indicating a very stable climatic pattern.
This data highlights the diverse climatic conditions across different regions of Vietnam, with northern Hanoi experiencing more pronounced seasonal changes compared to the southern and central cities of HCMC, Da Nang, and Can Tho.
Bài tham khảo 2
Introduction
The line graph illustrates the average monthly temperatures of four Vietnamese cities (Hanoi, Ho Chi Minh City, Da Nang, and Can Tho) throughout the year 2021.
Overview
Overall, Hanoi experienced the most significant fluctuations in temperature, with the highest peak occurring in July. In contrast, Ho Chi Minh City and Can Tho maintained relatively stable temperatures throughout the year. Da Nang’s temperatures showed a moderate increase and decrease pattern.
Body 1
Hanoi’s temperatures began at 17°C in January, rising steadily to reach a peak of 31°C in July before gradually decreasing to 18°C in December. Ho Chi Minh City started at 26°C in January, saw a slight increase to 30°C in April, and then remained relatively stable around 28-29°C for the rest of the year, ending at 26°C in December.
Body 2
Da Nang started with a temperature of 22°C in January and experienced a gradual increase, peaking at 31°C in July, similar to Hanoi, before declining to 23°C in December. Can Tho, on the other hand, maintained a relatively constant temperature throughout the year, starting at 27°C in January, peaking at 30°C in April, and stabilizing at 27°C from August to December.
Bài tham khảo 3
Introduction
The line graph illustrates the average monthly temperatures of four cities in Vietnam—Hanoi, Ho Chi Minh City, Da Nang, and Can Tho—in the year 2021.
Overview
Overall, Hanoi experiences the most significant temperature fluctuation throughout the year, while Ho Chi Minh City and Can Tho show relatively stable temperatures. Da Nang displays a moderate variation in temperature.
Body 1
In the early months of the year, Hanoi’s temperatures are the lowest among the four cities, starting at 17°C in January and gradually increasing to 31°C in July. From August, the temperature in Hanoi begins to decline, reaching 18°C in December. Ho Chi Minh City has a relatively stable temperature range, starting at 26°C in January and slightly fluctuating between 26°C and 30°C throughout the year, with a peak of 30°C in April and May.
Body 2
Da Nang’s temperatures start at 22°C in January and steadily rise to 31°C in July, after which they gradually decrease to 23°C in December. Can Tho’s temperature remains consistently high, starting at 27°C in January, peaking at 30°C in April, and then slightly declining to 27°C towards the end of the year. While both Da Nang and Can Tho experience a relatively narrow range of temperature variation compared to Hanoi, Can Tho maintains a more constant temperature compared to the other cities.
This analysis highlights the diverse climatic patterns across different regions of Vietnam, with significant temperature variations in Hanoi and relatively stable conditions in Ho Chi Minh City and Can Tho.