IELTS Writing Task 1 Line Graph: Đồ thị đường thể hiện lượng mưa hàng tháng trong một năm của sáu thành phố lớn trên thế giới, bao gồm New York, Hà Nội, TP. Hồ Chí Minh, London, Tokyo và Sydney. Số liệu cho thấy sự biến đổi về lượng mưa giữa các thành phố, phản ánh đặc điểm khí hậu và mùa của từng khu vực.
Bạn có thể đọc lại bài nói về Task 1 tại đây: IELTS Writing Task 1 cần lưu ý những gì?
Bạn cũng có thể đọc thêm bài viết này vì đề bài này là IELTS Writing Task 1 biểu đồ Line Graph.
IELTS Writing Task 1 Line Graph: the monthly rainfall
You should spent about 20 minutes on this task
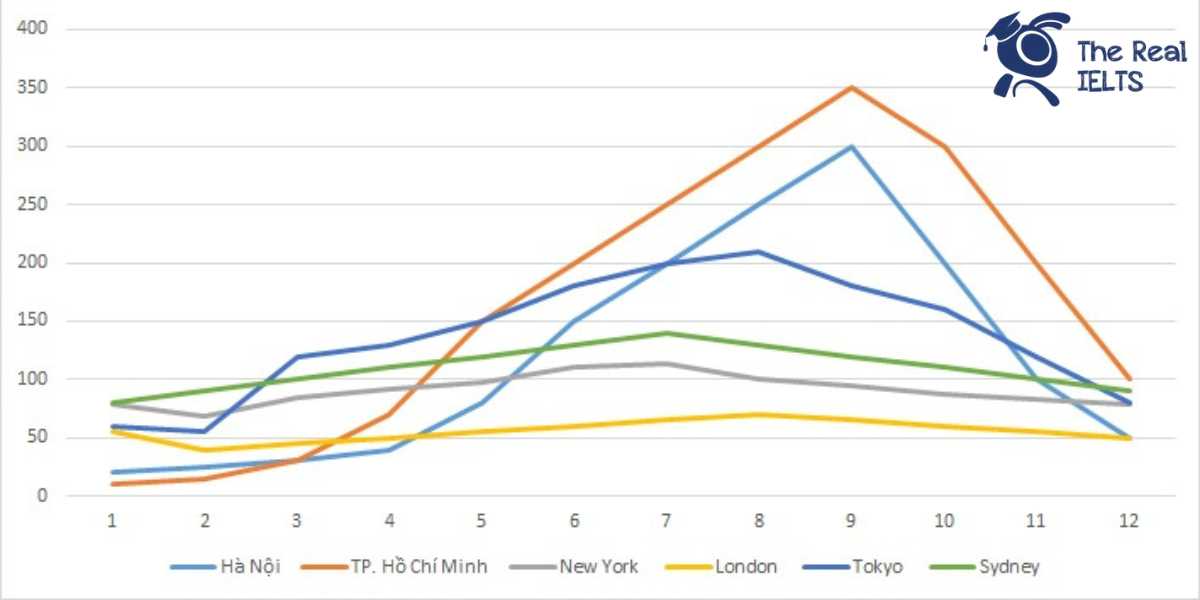
The line graph shows the monthly rainfall over a year for six major cities worldwide, including New York, Hanoi, Ho Chi Minh City, London, Tokyo, and Sydney. The data illustrates the variation in rainfall among these cities, reflecting the climate characteristics and seasons of each region.
You should write at least 150 words.

Bài Writing tham khảo 1
The line graph illustrates the monthly rainfall (in mm) in six cities—Hanoi, Ho Chi Minh City, New York, London, Tokyo, and Sydney—throughout a year.
Overall, the rainfall patterns vary significantly across these cities. Hanoi and Ho Chi Minh City experience a distinct wet season, while New York, London, Tokyo, and Sydney show more evenly distributed rainfall throughout the year with minor fluctuations.
In the first half of the year, rainfall in Hanoi and Ho Chi Minh City gradually increases, peaking in August and September respectively. Hanoi starts with 20 mm in January and reaches 300 mm by September. Ho Chi Minh City begins with 10 mm in January and reaches its highest at 350 mm in September.
Conversely, New York, London, Tokyo, and Sydney exhibit a more stable rainfall distribution. New York’s rainfall ranges between 69 mm and 114 mm throughout the year, with the highest in July. London’s rainfall fluctuates slightly between 40 mm and 70 mm, peaking in August. Tokyo sees a significant increase in rainfall from March, peaking at 210 mm in August before declining towards the end of the year. Sydney’s rainfall is relatively steady, ranging from 80 mm to 140 mm, with a peak in July.
In conclusion, while Hanoi and Ho Chi Minh City have a pronounced rainy season, the other cities experience a more balanced distribution of rainfall, with Tokyo and Sydney having notable peaks during the middle months.
Bài Writing tham khảo 2
The line graph illustrates the monthly average rainfall (in millimeters) for six cities: Hanoi, Ho Chi Minh City, New York, London, Tokyo, and Sydney throughout the year.
Overview: Overall, Ho Chi Minh City experiences the highest rainfall during the latter half of the year, while London has the most consistent rainfall pattern. Notably, both Hanoi and Tokyo show significant increases in precipitation during the mid-year months, whereas New York has relatively steady rainfall with minor fluctuations.
Body 1: In detail, Hanoi starts with 20 mm of rain in January, gradually increasing to 80 mm by May, then surging to a peak of 300 mm in September, before declining to 50 mm by December. Similarly, Ho Chi Minh City begins at 10 mm in January, witnessing a sharp rise from May’s 150 mm to a peak of 350 mm in September, and then decreasing to 100 mm in December. Tokyo also follows a similar trend with relatively low rainfall of 60 mm in January, peaking at 210 mm in August, and dropping back to 80 mm in December.
Body 2: New York presents a different pattern, starting at 78 mm in January, slightly fluctuating and peaking at 114 mm in July, and ending at 79 mm in December. London maintains a more stable rainfall distribution, starting at 55 mm in January, with minor ups and downs, and reaching 70 mm in August, then reverting to 50 mm by December. In contrast, Sydney begins with 80 mm in January, gradually increasing to 140 mm by July, and then decreasing back to 90 mm in December.
In summary, the graph highlights distinct rainfall patterns in each city, with tropical cities like Hanoi and Ho Chi Minh City showing marked rainy seasons, while temperate cities like London and New York exhibit more consistent rainfall throughout the year.
Bài Writing tham khảo 3
The line graph illustrates the monthly rainfall (in millimeters) for six cities: Hanoi, Ho Chi Minh City, New York, London, Tokyo, and Sydney, over the course of a year.
Overall, it can be observed that the cities in Vietnam (Hanoi and Ho Chi Minh City) experience a pronounced increase in rainfall from the beginning of the year to mid-year, peaking in August and then decreasing towards the end of the year. New York and London display relatively stable rainfall throughout the year, while Tokyo and Sydney have their own distinct seasonal variations.
In the first half of the year, Hanoi and Ho Chi Minh City both start with low rainfall levels, with Ho Chi Minh City receiving less than Hanoi initially (10 mm vs. 20 mm in January). However, both cities see substantial increases, particularly from May onwards. Ho Chi Minh City’s rainfall peaks at 350 mm in September, whereas Hanoi reaches its highest at 300 mm in the same month.
New York and London show more consistency in their monthly rainfall. New York ranges from a low of 69 mm in February to a high of 114 mm in July. London’s rainfall varies less dramatically, ranging from 40 mm in February to 70 mm in August.
Tokyo experiences significant fluctuations, beginning with 60 mm in January, peaking at 210 mm in August, and then decreasing. Sydney shows a steady increase from 80 mm in January, peaking in July at 140 mm, and then gradually decreasing back to 90 mm by December.
In summary, the data reveals diverse rainfall patterns among the cities, with Vietnamese cities having the most pronounced seasonal changes, while New York and London maintain more stable rainfall levels throughout the year. Tokyo and Sydney also exhibit notable seasonal rainfall variations.