IELTS Writing Task 1 yêu cầu bạn mô tả biểu đồ thể hiện lượng tiêu thụ thuốc lá hàng ngày hàng tháng của bốn thành phố trong năm 2021. Bạn cần phân tích và so sánh dữ liệu, nhấn mạnh những xu hướng chính và sự khác biệt giữa các thành phố. Chú ý sử dụng ngôn ngữ rõ ràng, mạch lạc.
Bạn có thể đọc lại bài nói về Task 1 tại đây: IELTS Writing Task 1 cần lưu ý những gì?
Bạn cũng có thể đọc thêm bài viết này vì đề bài này là IELTS Writing Task 1 biểu đồ Line Graph.
IELTS Writing Task 1 Line Graph: Tobacco
You should spent about 20 mintutes on this task
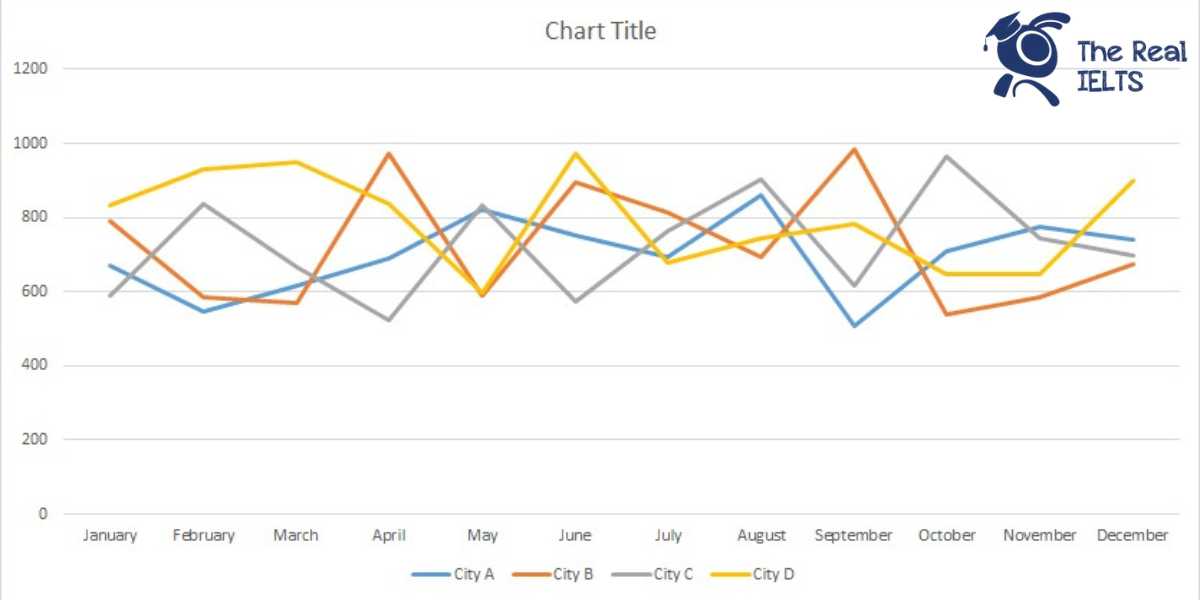
IELTS Writing Task 1 requires you to describe a chart showing the daily and monthly tobacco consumption of four cities in 2021. You need to analyze and compare the data, highlighting key trends and differences between the cities. Pay attention to using clear and coherent language.
You should write at least 150 words.
| Tháng | City A | City B | City C | City D |
| January | 672 | 792 | 588 | 835 |
| February | 547 | 587 | 837 | 931 |
| March | 617 | 570 | 665 | 948 |
| April | 692 | 972 | 525 | 838 |
| May | 823 | 588 | 833 | 599 |
| June | 751 | 896 | 572 | 972 |
| July | 695 | 814 | 765 | 677 |
| August | 859 | 693 | 904 | 743 |
| September | 509 | 986 | 615 | 785 |
| October | 711 | 539 | 964 | 647 |
| November | 777 | 587 | 743 | 647 |
| December | 742 | 674 | 697 | 898 |

Bài tham khảo 1
The line graph illustrates the daily consumption of cigarettes (measured in packs) in four cities—City A, City B, City C, and City D—over each month of the year 2021.
Overall, the graph shows fluctuations in cigarette consumption across all four cities throughout the year. Notably, City D consistently reported the highest daily consumption in several months, while City A and City C displayed more moderate levels with a few peaks.
In the first half of the year, City A started with a high consumption of 672 packs in January, which then dipped to 547 packs in February, followed by a fluctuating increase, reaching a peak of 823 packs in May. City B experienced a high of 792 packs in January, then dropped to 570 packs in March, and saw a significant rise to 972 packs in April before declining again.
City C’s consumption was initially lower compared to other cities, with a notable peak in February at 837 packs and another significant increase in August to 904 packs. City D began the year with the highest consumption at 835 packs in January, peaking at 948 packs in March and experiencing a significant rise again in June to 972 packs.
In the second half of the year, City A’s cigarette consumption varied, peaking again at 859 packs in August before decreasing towards the end of the year. City B showed the highest variability with a peak in September at 986 packs. City C also displayed fluctuating trends, with another peak in October at 964 packs. City D, after a decline mid-year, saw its highest consumption in December at 898 packs.
In conclusion, while each city exhibited different patterns of cigarette consumption throughout the year, City D stood out for its consistently high levels, particularly in March, June, and December. City B’s cigarette consumption showed the most volatility, with significant peaks in April and September.
Bài tham khảo 2
The line graph illustrates the monthly cigarette consumption (in packs) in four cities throughout the year 2021.
Overview:
Overall, City D consistently exhibited the highest monthly consumption of cigarettes, while City A and City C showed significant fluctuations. City B’s consumption remained relatively stable but experienced noticeable peaks and troughs.
Body 1:
City A’s cigarette consumption started at 672 packs in January and experienced a decline to its lowest point of 509 packs in September. Despite this drop, there was a significant rise in consumption in the subsequent months, peaking at 859 packs in August before ending the year at 742 packs. City B, starting at 792 packs in January, showed significant volatility, reaching a peak of 986 packs in September and a low of 539 packs in October. This city also saw a second peak of 972 packs in April.
Body 2:
City C displayed the lowest consumption in April with 525 packs and the highest in October with 964 packs. The city’s consumption patterns were erratic, with sharp increases and decreases throughout the year. City D had the highest overall consumption, beginning at 835 packs in January and reaching its peak at 972 packs in June. Although there was a notable dip to 599 packs in May, City D generally maintained high consumption levels, closing the year at 898 packs in December.
In conclusion, while City D showed the highest cigarette consumption overall, the other cities demonstrated varied and fluctuating patterns throughout the year.
Bài tham khảo 3
The line graph illustrates the daily cigarette consumption, measured in packs, in four cities (City A, City B, City C, and City D) over the course of 2021.
Overall, the data reveals fluctuations in cigarette consumption across all four cities throughout the year, with City D consistently showing the highest levels of consumption for most months, while City C had the lowest levels in several months.
In the first half of the year, City A started with a high consumption of 672 packs in January, dropped to a low of 547 packs in February, and then experienced a steady increase, reaching 823 packs in May. City B’s consumption showed an initial high of 792 packs in January, which dipped to 570 packs in March, before peaking sharply at 972 packs in April. City C, beginning with 588 packs in January, saw a significant rise in February to 837 packs but then dropped to 525 packs by April. City D exhibited the highest initial consumption of 835 packs in January, peaking at 948 packs in March, and then decreased to 599 packs in May.
In the latter half of the year, City A saw fluctuations with a peak of 859 packs in August and a drop to 509 packs in September, before stabilizing around 742 packs in December. City B showed a peak in consumption in September with 986 packs, followed by a general decline to 674 packs by December. City C had varied figures, peaking at 964 packs in October and settling at 697 packs in December. City D, which saw the highest figures overall, peaked at 972 packs in June, dropped to 647 packs in October and November, and ended the year at 898 packs in December.
In conclusion, while there were noticeable monthly fluctuations in cigarette consumption across all four cities, City D consistently maintained the highest consumption rates, whereas City A and City B showed significant variability throughout the year.