IELTS Writing Task 1 yêu cầu thí sinh mô tả biểu đồ về số vụ tai nạn giao thông hàng tháng trong năm 2020 của bốn quốc gia khác nhau. Bài viết nên tập trung vào việc so sánh xu hướng, điểm cao nhất và thấp nhất, cũng như bất kỳ sự thay đổi nào đáng chú ý giữa các quốc gia trong suốt năm.
Bạn có thể đọc lại bài nói về Task 1 tại đây: IELTS Writing Task 1 cần lưu ý những gì?
Bạn cũng có thể đọc thêm bài viết này vì đề bài này là IELTS Writing Task 1 biểu đồ Line Graph.
IELTS Writing Task 1 Line Graph: Traffic Accident
You should spent about 20 mintutes on this task
IELTS Writing Task 1 requires candidates to describe a chart showing the monthly traffic accident numbers in 2020 for four different countries. The essay should focus on comparing trends, the highest and lowest points, as well as any notable changes among the countries throughout the year.
You should write at least 150 words.
| Tháng | Quốc gia A | Quốc gia B | Quốc gia C | Quốc gia D |
| Tháng 1 | 500 | 450 | 600 | 550 |
| Tháng 2 | 480 | 430 | 620 | 530 |
| Tháng 3 | 470 | 420 | 610 | 520 |
| Tháng 4 | 460 | 410 | 600 | 510 |
| Tháng 5 | 450 | 400 | 590 | 500 |
| Tháng 6 | 440 | 390 | 580 | 490 |
| Tháng 7 | 430 | 380 | 570 | 480 |
| Tháng 8 | 420 | 370 | 560 | 470 |
| Tháng 9 | 410 | 360 | 550 | 460 |
| Tháng 10 | 400 | 350 | 540 | 450 |
| Tháng 11 | 390 | 340 | 530 | 440 |
| Tháng 12 | 380 | 330 | 520 | 430 |

Bài tham khảo 1
Introduction
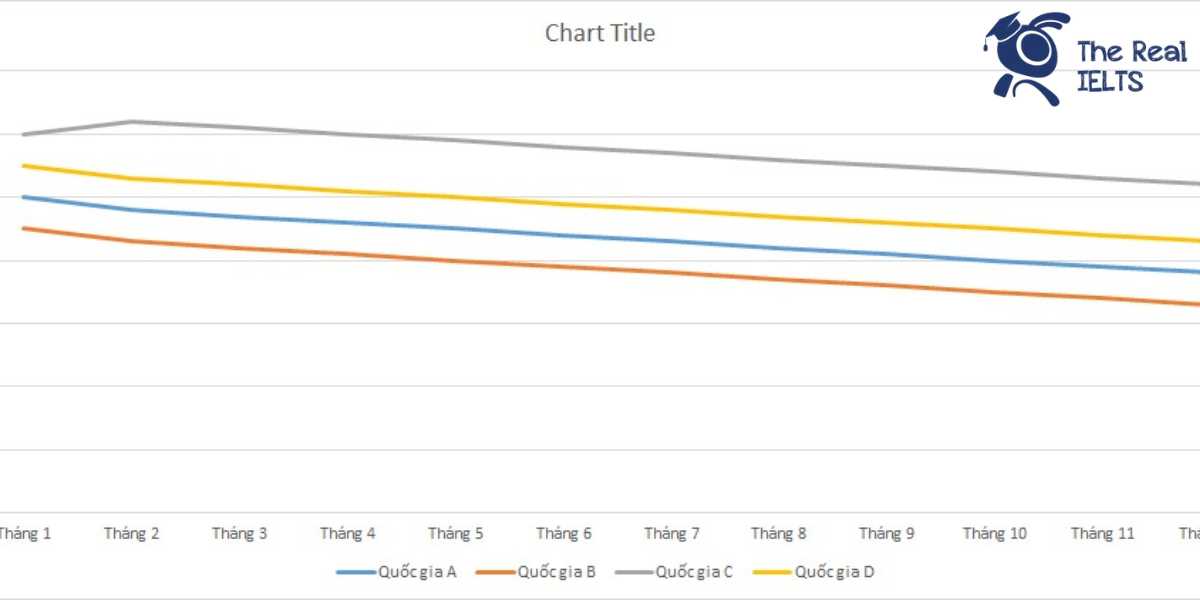
The line graph illustrates the monthly traffic accident statistics for the year 2020 in four countries: Country A, Country B, Country C, and Country D.
Overview
Overall, the number of traffic accidents showed a downward trend across all four countries throughout the year. Notably, Country C consistently recorded the highest number of accidents each month, whereas Country B had the lowest figures.
Body 1
In January, Country C had the highest number of accidents with 600 cases, followed by Country D with 550 accidents. Country A and Country B reported 500 and 450 accidents respectively. As the months progressed, a steady decline in the number of accidents was observed in all countries. By June, the figures for Country A had decreased to 440, while Country B, Country C, and Country D recorded 390, 580, and 490 accidents respectively.
Body 2
The downward trend continued into the second half of the year. By December, Country A’s accident numbers had reduced to 380, and Country B’s had fallen to 330. Country C, while still having the highest number, showed a significant reduction to 520 accidents. Country D also saw a decrease, ending the year with 430 accidents. This consistent decrease highlights a possible improvement in road safety measures or other contributing factors in reducing traffic accidents over the year.
Bài tham khảo 2
IELTS Writing Task 1 Example:
The line graph illustrates the monthly number of traffic accidents in four countries (A, B, C, and D) throughout the year 2020.
Overview: Overall, all four countries experienced a gradual decrease in the number of traffic accidents over the year. Country C consistently had the highest number of traffic accidents each month, while Country B had the lowest.
Body 1: In January, Country C recorded the highest number of traffic accidents with 600 incidents, followed by Country D with 550, Country A with 500, and Country B with 450. Over the next few months, there was a steady decline in traffic accidents across all countries. By June, the numbers had reduced to 440 in Country A, 390 in Country B, 580 in Country C, and 490 in Country D. This trend continued into the second half of the year.
Body 2: From July to December, the downward trend persisted. By December, the number of traffic accidents had decreased to 380 in Country A, 330 in Country B, 520 in Country C, and 430 in Country D. The data shows that the decrease was more pronounced in Country B, which saw a reduction of 120 incidents from January to December, compared to Country C, which had the smallest decrease of 80 incidents over the same period.
In conclusion, the line graph highlights a general decline in traffic accidents across the four countries in 2020, with Country C consistently reporting the highest figures and Country B the lowest.
Bài tham khảo 3
Introduction
The line graph provides a monthly breakdown of traffic accidents for four countries (A, B, C, and D) in the year 2020.
Overview
Overall, the data shows a declining trend in the number of traffic accidents across all four countries throughout the year. Country C consistently reported the highest number of accidents, while Country B had the lowest figures.
Body 1
In January, Country C started with the highest number of accidents at 600, followed by Country D with 550. Country A and B had 500 and 450 accidents, respectively. Over the next few months, all countries experienced a gradual decline in traffic accidents. By mid-year in June, the figures had reduced to 440 for Country A, 390 for Country B, 580 for Country C, and 490 for Country D.
Body 2
The downward trend continued steadily for the remainder of the year. In December, Country A recorded 380 accidents, while Country B had 330. Country C, despite maintaining the highest accident rates throughout, saw a decrease to 520. Country D ended the year with 430 accidents. The data clearly indicates a consistent decrease in traffic accidents in all four countries over the twelve months.