IELTS Writing Task 1 yêu cầu phân tích biểu đồ về tỷ lệ thất nghiệp hàng tháng của 4 thành phố trong năm 2021. Bài viết cần nêu rõ các xu hướng chính, so sánh sự biến động giữa các thành phố và chỉ ra những thay đổi quan trọng. Đảm bảo sử dụng ngôn ngữ mô tả chính xác và logic.
Bạn có thể đọc lại bài nói về Task 1 tại đây: IELTS Writing Task 1 cần lưu ý những gì?
Bạn cũng có thể đọc thêm bài viết này vì đề bài này là IELTS Writing Task 1 biểu đồ Line Graph.
IELTS Writing Task 1 Line Graph
You should spent about 20 mintutes on this task
IELTS Writing Task 1 requires analyzing a chart on the monthly unemployment rates of 4 cities in 2021. The essay should highlight the main trends, compare the fluctuations between the cities, and point out significant changes. Ensure to use accurate and logical descriptive language.
You should write at least 150 words.
| Tháng | Thành phố A | Thành phố B | Thành phố C | Thành phố D |
| 1 | 5.2% | 6.1% | 4.8% | 5.5% |
| 2 | 5.3% | 6.0% | 4.7% | 5.6% |
| 3 | 5.1% | 6.2% | 4.9% | 5.4% |
| 4 | 5.0% | 6.0% | 4.8% | 5.3% |
| 5 | 4.9% | 5.9% | 4.7% | 5.2% |
| 6 | 4.8% | 5.8% | 4.6% | 5.1% |
| 7 | 4.7% | 5.7% | 4.5% | 5.0% |
| 8 | 4.6% | 5.6% | 4.4% | 4.9% |
| 9 | 4.5% | 5.5% | 4.3% | 4.8% |
| 10 | 4.4% | 5.4% | 4.2% | 4.7% |
| 11 | 4.3% | 5.3% | 4.1% | 4.6% |
| 12 | 4.2% | 5.2% | 4.0% | 4.5% |

Bài tham khảo 1
Introduction:
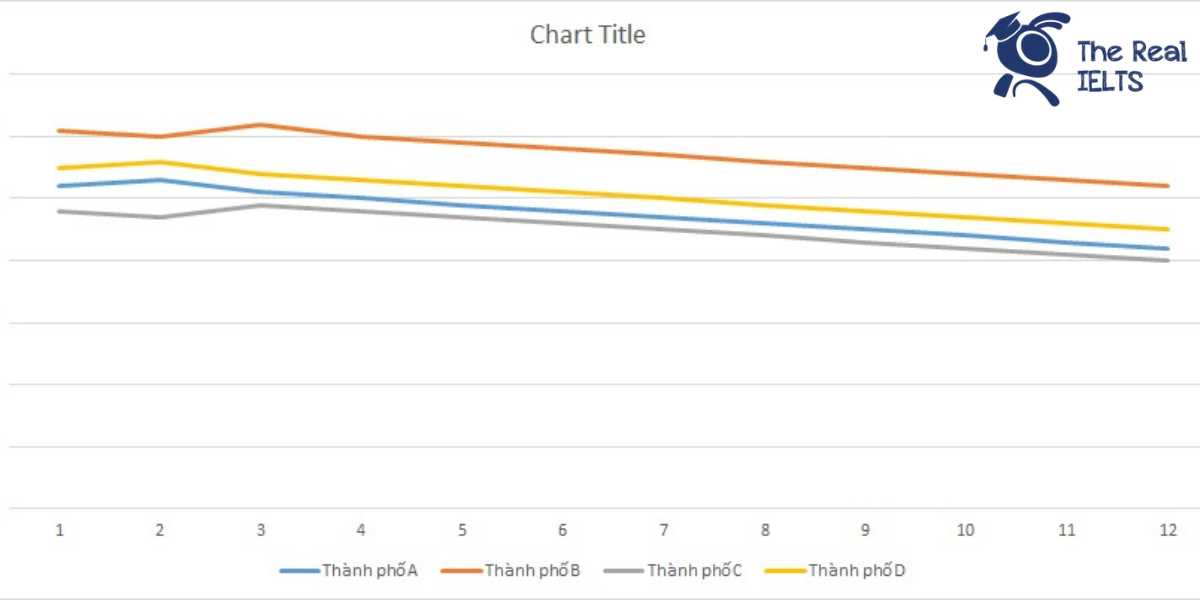
The line graph illustrates the monthly unemployment rates in four cities—City A, City B, City C, and City D—throughout the year 2021.
Overview:
Overall, the unemployment rates in all four cities showed a downward trend over the course of the year. City B consistently had the highest unemployment rate, while City C had the lowest.
Body 1:
At the beginning of the year, City B had the highest unemployment rate at 6.1%, followed by City D at 5.5%, City A at 5.2%, and City C at 4.8%. As the months progressed, the unemployment rate in City B fluctuated slightly but remained the highest, ending the year at 5.2%. On the other hand, City A saw a steady decline from 5.2% in January to 4.2% in December.
Body 2:
City C experienced a similar downward trend, starting at 4.8% in January and reaching 4.0% by December, maintaining the lowest unemployment rate among the four cities throughout the year. City D also saw a gradual decrease, beginning at 5.5% in January and dropping to 4.5% by December. Despite these decreases, the rates in City D remained higher than those in City A and City C, but lower than in City B.
In conclusion, all four cities experienced a reduction in unemployment rates in 2021, with City B remaining the highest and City C the lowest throughout the year.
Bài tham khảo 2
The line graph illustrates the monthly unemployment rates for four cities—City A, City B, City C, and City D—throughout the year 2021.
Overall, the graph reveals a general downward trend in the unemployment rates for all four cities over the course of the year. City B consistently had the highest unemployment rates, while City C had the lowest.
In more detail, City A started the year with an unemployment rate of 5.2% in January and experienced a steady decline, reaching 4.2% by December. City B had the highest initial rate of 6.1% in January, which also decreased gradually, ending at 5.2% in December.
City C, with the lowest initial rate of 4.8% in January, saw a consistent decrease to 4.0% by the year’s end. Similarly, City D’s unemployment rate dropped from 5.5% in January to 4.5% in December, showing a steady decline.
In summary, all four cities showed a consistent reduction in unemployment rates over the year, with City B having the highest rates throughout, and City C maintaining the lowest.
Bài tham khảo 3
The line graph illustrates the monthly unemployment rates in four cities (A, B, C, and D) throughout the year 2021.
Overall, it is clear that the unemployment rates in all four cities showed a downward trend over the year. City A and City C experienced the most significant declines, while City B and City D had relatively moderate decreases.
In January, City B had the highest unemployment rate at 6.1%, followed by City D at 5.5%, City A at 5.2%, and City C at 4.8%. City B’s rate fluctuated slightly in the first quarter but consistently decreased from April onwards, ending the year at 5.2%. Similarly, City D’s rate saw a steady decline, dropping from 5.5% in January to 4.5% in December.
City A started with an unemployment rate of 5.2% in January, which gradually decreased each month to reach 4.2% by December. City C also showed a consistent decrease, starting at 4.8% in January and ending at 4.0% in December, making it the city with the lowest unemployment rate by the end of the year.
In summary, while all four cities saw reductions in their unemployment rates over the year, City A and City C experienced the most notable improvements, highlighting the effective measures taken in these cities to combat unemployment.