IELTS Writing Task 1 yêu cầu bạn mô tả biểu đồ tỷ lệ thất nghiệp từ năm 2011 đến năm 2022 của bốn quốc gia. Bạn cần phân tích và so sánh sự biến đổi qua các năm, nêu rõ các xu hướng chính, điểm cao nhất, thấp nhất và bất kỳ thay đổi đột ngột nào. Kỹ năng phân tích và trình bày dữ liệu sẽ được đánh giá.
Bạn có thể đọc lại bài nói về Task 1 tại đây: IELTS Writing Task 1 cần lưu ý những gì?
Bạn cũng có thể đọc thêm bài viết này vì đề bài này là IELTS Writing Task 1 biểu đồ Line Graph.
Bạn cũng có thể Xây Dựng Lộ Trình Cá Nhân Hóa của mình tại link.
IELTS Writing Task 1 Line Graph: Unemployment Rate 2
You should spent about 20 mintutes on this task
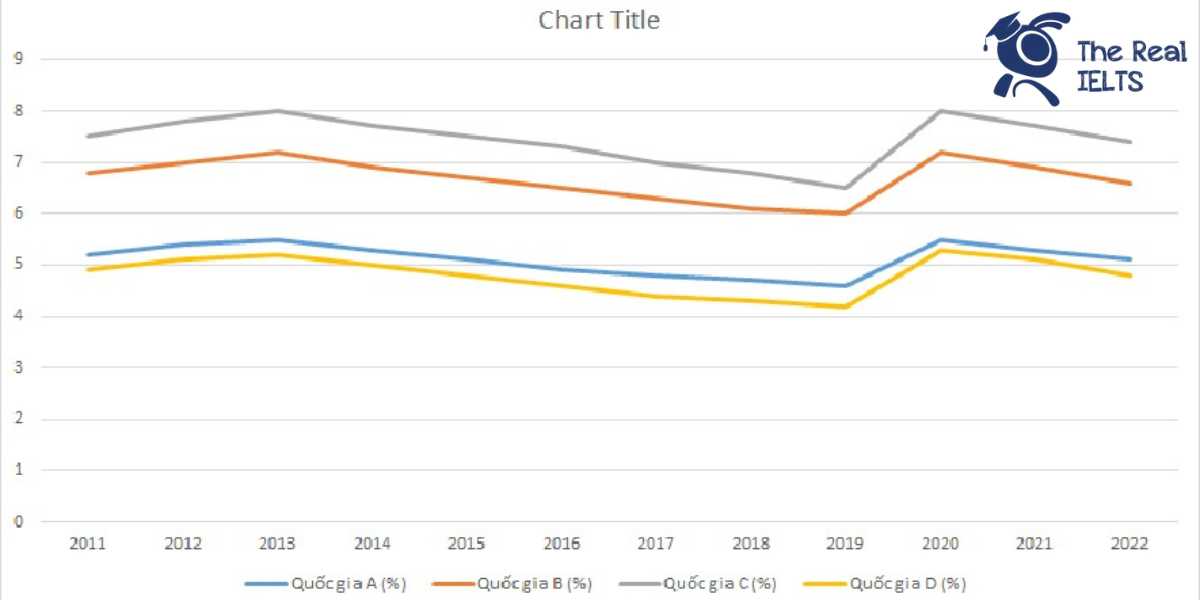
IELTS Writing Task 1 requires you to describe the unemployment rate chart from 2011 to 2022 for four countries. You need to analyze and compare the changes over the years, highlight the main trends, highest and lowest points, and any sudden changes. Your data analysis and presentation skills will be assessed.
You should write at least 150 words.
| Năm | Quốc gia A (%) | Quốc gia B (%) | Quốc gia C (%) | Quốc gia D (%) |
| 2011 | 5.2 | 6.8 | 7.5 | 4.9 |
| 2012 | 5.4 | 7.0 | 7.8 | 5.1 |
| 2013 | 5.5 | 7.2 | 8.0 | 5.2 |
| 2014 | 5.3 | 6.9 | 7.7 | 5.0 |
| 2015 | 5.1 | 6.7 | 7.5 | 4.8 |
| 2016 | 4.9 | 6.5 | 7.3 | 4.6 |
| 2017 | 4.8 | 6.3 | 7.0 | 4.4 |
| 2018 | 4.7 | 6.1 | 6.8 | 4.3 |
| 2019 | 4.6 | 6.0 | 6.5 | 4.2 |
| 2020 | 5.5 | 7.2 | 8.0 | 5.3 |
| 2021 | 5.3 | 6.9 | 7.7 | 5.1 |
| 2022 | 5.1 | 6.6 | 7.4 | 4.8 |

Bài tham khảo 1
Introduction
This report analyzes the unemployment rates of four countries (Country A, Country B, Country C, and Country D) from 2011 to 2022, based on the provided hypothetical data.
Overview
Overall, the unemployment rates of all four countries showed fluctuations over this period. Country C consistently had the highest unemployment rate, while Country D had the lowest. Countries A and B exhibited a general downward trend in their unemployment rates, despite experiencing slight increases in some years.
Body 1
Country A started with an unemployment rate of 5.2% in 2011, rising to 5.5% in 2013 before gradually declining to 4.6% in 2019. The rate then increased again to 5.5% in 2020, but decreased to 5.1% by 2022. Similarly, Country B showed a parallel trend, beginning at 6.8% in 2011, peaking at 7.2% in 2013, then gradually falling to 6.0% in 2019. The rate rose to 7.2% in 2020 before dropping to 6.6% in 2022.
Body 2
Country C had the highest unemployment rates throughout, starting at 7.5% in 2011 and reaching its peak at 8.0% in 2013 and again in 2020. Despite a gradual decline from 2014 to 2019, the rate remained high, ending at 7.4% in 2022. In contrast, Country D had the lowest rates, starting at 4.9% in 2011 and steadily decreasing to 4.2% in 2019. The rate increased slightly to 5.3% in 2020 but then fell to 4.8% in 2022.
Conclusion
In summary, despite fluctuations, the general trend indicates a decrease in unemployment rates across all four countries, with Country C and Country D showing the most distinct patterns in the data.
Bài tham khảo 2
Introduction:
The table illustrates the unemployment rates in four countries (A, B, C, and D) from 2011 to 2022.
Overview:
Overall, Country A and Country D experienced a general decrease in unemployment rates over the period, while Country B and Country C showed fluctuations but ultimately reduced their rates. Country C consistently had the highest unemployment rates, whereas Country D had the lowest.
Body 1:
Country A saw its unemployment rate decline from 5.2% in 2011 to a low of 4.6% in 2019, then spiked to 5.5% in 2020 before gradually decreasing again to 5.1% in 2022. Similarly, Country D’s rate decreased from 4.9% in 2011 to 4.2% in 2019, experienced an increase to 5.3% in 2020, and then dropped back to 4.8% by 2022.
Body 2:
Country B’s unemployment rate started at 6.8% in 2011, increased slightly to 7.2% in 2013, and then steadily declined to 6.0% by 2019. However, it also saw a rise to 7.2% in 2020, followed by a reduction to 6.6% by 2022. Country C, on the other hand, had the highest unemployment rates, starting at 7.5% in 2011 and peaking at 8.0% in 2013 and 2020. Despite these fluctuations, its rate decreased to 7.4% by 2022.
Bài tham khảo 3
Introduction
The table illustrates the unemployment rates in four countries, namely Country A, Country B, Country C, and Country D, over a period from 2011 to 2022.
Overview
Overall, the data shows that while the unemployment rates fluctuated in all four countries, Country D consistently had the lowest rates, whereas Country C experienced the highest rates throughout the period.
Body 1
In detail, Country A started with a 5.2% unemployment rate in 2011, which peaked at 5.5% in 2013 before gradually decreasing to 4.6% in 2019. However, there was a notable increase in 2020 to 5.5%, followed by a slight decline to 5.1% by 2022. Similarly, Country B began with a 6.8% unemployment rate in 2011, reaching its highest at 7.2% in both 2013 and 2020. From there, the rate decreased to 6.6% by 2022.
Body 2
Country C exhibited the highest unemployment rates among the four, starting at 7.5% in 2011 and rising to 8.0% in both 2013 and 2020. The rate then fell to 7.4% by 2022. On the other hand, Country D maintained the lowest unemployment rates, beginning at 4.9% in 2011, decreasing steadily to 4.2% by 2019. After a brief increase to 5.3% in 2020, the rate dropped again to 4.8% in 2022.
Bài tham khảo 4
The table presents the annual unemployment rates from 2011 to 2022 for four countries: Country A, Country B, Country C, and Country D.
Overall, Country C consistently had the highest unemployment rates throughout the period, while Country D maintained the lowest rates. Countries A and B showed fluctuations but generally experienced a downward trend.
In 2011, Country A’s unemployment rate was 5.2%, which gradually decreased to 4.6% by 2019 before rising again to 5.5% in 2020. From 2020 onwards, it fell slightly to 5.1% by 2022. Country B started with a 6.8% unemployment rate in 2011, which increased to 7.2% by 2013, then decreased to 6.0% by 2019. After a peak of 7.2% in 2020, it declined to 6.6% by 2022.
Country C experienced the highest rates, starting at 7.5% in 2011, peaking at 8.0% in 2013 and 2020, then falling to 7.4% by 2022. In contrast, Country D’s rates were the lowest, beginning at 4.9% in 2011 and decreasing to 4.2% by 2019. A rise to 5.3% occurred in 2020, followed by a decline to 4.8% in 2022.
In summary, despite fluctuations, the general trend indicates a decline in unemployment rates for Countries A, B, and D, while Country C consistently had higher rates, peaking in 2013 and 2020.
Bài tham khảo 5
Introduction
The table illustrates the unemployment rates in four countries, namely Country A, Country B, Country C, and Country D, over a period from 2011 to 2022.
Overview
Overall, it is evident that Country A and Country D experienced a general decrease in unemployment rates, while Country B and Country C showed fluctuations with a tendency to decrease towards the end of the period. Country C consistently had the highest unemployment rates, whereas Country D had the lowest.
Body 1
In 2011, Country C had the highest unemployment rate at 7.5%, followed by Country B at 6.8%, Country A at 5.2%, and Country D at 4.9%. Over the next few years, the unemployment rates in Country A and Country D decreased steadily. By 2019, Country A’s rate had dropped to 4.6% and Country D’s to 4.2%. However, both countries saw a spike in 2020, likely due to external factors, with Country A rising to 5.5% and Country D to 5.3%.
Body 2
Country B and Country C exhibited more fluctuation during the period. Country B’s unemployment rate peaked at 7.2% in 2013 and 2020, but generally showed a downward trend, ending at 6.6% in 2022. Similarly, Country C’s rate peaked at 8.0% in 2013 and 2020 but fell to 7.4% by 2022. Despite these fluctuations, the overall trend for both countries was a gradual decline in unemployment rates towards the end of the period.
In summary, while all four countries experienced varying levels of unemployment, the general trend over the period was a decline, with significant peaks in certain years.