IELTS Writing Task 1 yêu cầu mô tả biểu đồ tỷ lệ thất nghiệp trong ngành IT hàng tháng năm 2020 của 4 quốc gia. Bài viết cần nêu rõ xu hướng, so sánh số liệu giữa các quốc gia, và chú ý các thay đổi quan trọng. Người viết nên sử dụng ngôn ngữ chính xác, tránh lặp từ và phân tích khách quan.
Bạn có thể đọc lại bài nói về Task 1 tại đây: IELTS Writing Task 1 cần lưu ý những gì?
Bạn cũng có thể đọc thêm bài viết này vì đề bài này là IELTS Writing Task 1 biểu đồ Line Graph.
IELTS Writing Task 1 Line Graph: Unemployment Rates
You should spent about 20 mintutes on this task
IELTS Writing Task 1 requires describing the chart of monthly unemployment rates in the IT sector in 2020 for four countries. The essay should clearly state the trends, compare the figures between the countries, and highlight significant changes. The writer should use precise language, avoid repetition, and provide an objective analysis.
You should write at least 150 words.
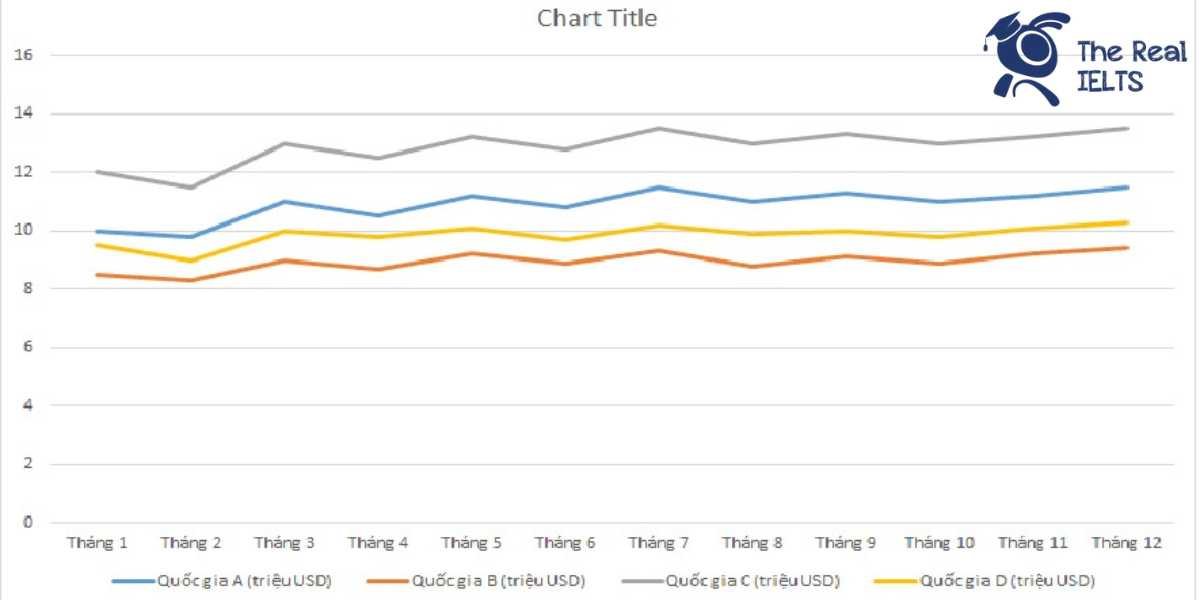
| Tháng | Quốc gia A | Quốc gia B | Quốc gia C | Quốc gia D |
| Tháng 1 | 3.5% | 4.2% | 5.1% | 3.8% |
| Tháng 2 | 3.6% | 4.0% | 5.0% | 3.7% |
| Tháng 3 | 3.8% | 4.3% | 5.2% | 4.0% |
| Tháng 4 | 4.2% | 4.8% | 5.7% | 4.5% |
| Tháng 5 | 4.5% | 5.0% | 6.0% | 4.8% |
| Tháng 6 | 4.8% | 5.3% | 6.2% | 5.0% |
| Tháng 7 | 4.9% | 5.5% | 6.4% | 5.2% |
| Tháng 8 | 5.0% | 5.6% | 6.5% | 5.3% |
| Tháng 9 | 5.1% | 5.7% | 6.6% | 5.4% |
| Tháng 10 | 5.0% | 5.5% | 6.4% | 5.2% |
| Tháng 11 | 4.8% | 5.3% | 6.2% | 5.0% |
| Tháng 12 | 4.6% | 5.1% | 6.0% | 4.8% |

Bài tham khảo 1
Introduction:
The line graph illustrates the monthly unemployment rates in the IT sector for four countries, labeled as Country A, Country B, Country C, and Country D, over the year 2020.
Overview:
Overall, the unemployment rates in the IT sector increased in all four countries over the first nine months of 2020, with a slight decrease towards the end of the year. Country C consistently had the highest unemployment rate, while Country A had the lowest throughout the year.
Body 1:
In January 2020, Country C had the highest unemployment rate at 5.1%, followed by Country B at 4.2%, Country D at 3.8%, and Country A at 3.5%. The rates for Country A and Country B showed a gradual increase, reaching their peak in September at 5.1% and 5.7%, respectively. After September, both countries saw a slight decline, with Country A ending the year at 4.6% and Country B at 5.1%.
Body 2:
Country C experienced a steady rise from 5.1% in January to its peak of 6.6% in September. However, this was followed by a slight decrease, ending the year at 6.0%. Country D showed a similar trend, starting at 3.8% in January and peaking at 5.4% in September, before dropping back to 4.8% in December. Despite the fluctuations, Country C had the highest unemployment rate among the four countries throughout the year.
Conclusion:
In summary, while all four countries experienced an increase in IT unemployment rates during 2020, Country C had the highest rates consistently, and Country A maintained the lowest rates. There was a general trend of rising unemployment rates in the first nine months, followed by a slight recovery in the last three months.
Bài tham khảo 2
The line graph illustrates the monthly unemployment rates in the IT sector for four countries (A, B, C, and D) throughout the year 2020.
Overview: Overall, the unemployment rates in the IT sector for all four countries showed a general upward trend during the first half of the year, followed by a slight decline in the latter months. Country C consistently had the highest unemployment rate, while Country A maintained the lowest rates throughout the year.
Body 1: At the beginning of the year, Country C had the highest unemployment rate at 5.1%, followed by Country B at 4.2%, Country D at 3.8%, and Country A at 3.5%. Over the next few months, the rates for all countries increased steadily. By June, Country C’s unemployment rate peaked at 6.2%, while Country B and Country D reached 5.3% and 5.0%, respectively. Country A also saw an increase, reaching 4.8%.
Body 2: In the second half of the year, the unemployment rates began to stabilize. Country C’s rate remained the highest, fluctuating slightly but remaining around 6.4% to 6.6%. Countries B and D saw their highest rates in August and September at 5.6% and 5.4%, respectively, before decreasing gradually. By December, the unemployment rates had decreased to 6.0% for Country C, 5.1% for Country B, 4.8% for Country D, and 4.6% for Country A, showing a slight improvement from the mid-year peak.
Overall, the data reveals that while there were fluctuations in unemployment rates throughout the year, each country experienced a similar trend of rising unemployment in the first half of the year, followed by a gradual decline towards the end.
Bài tham khảo 3
Introduction
The line graph illustrates the monthly unemployment rates in the IT sector for four countries (A, B, C, and D) throughout the year 2020.
Overview
Overall, the unemployment rates in all four countries exhibited an upward trend for the first nine months, followed by a slight decline in the last three months of the year. Among the four countries, Country C consistently had the highest unemployment rate, while Country A had the lowest rate for most of the year.
Body 1
In January, Country A started with an unemployment rate of 3.5%, which increased steadily to 5.1% by September before decreasing slightly to 4.6% in December. Similarly, Country B experienced an increase from 4.2% in January to 5.7% in September, followed by a drop to 5.1% by the end of the year.
Body 2
Country C consistently showed the highest unemployment rates, beginning at 5.1% in January and peaking at 6.6% in September. It then decreased to 6.0% in December. Country D had the lowest rate at the start, 3.8%, but this also rose to 5.4% by September, before ending the year at 4.8%.
Overall, while all countries faced increasing unemployment rates in the IT sector during the first nine months of 2020, a modest recovery was observed in the last quarter of the year.