IELTS Writing Task 1 yêu cầu mô tả biểu đồ thể hiện lượng rác thải thu gom hàng tháng tại 4 quốc gia trong năm 2010. Thí sinh cần phân tích dữ liệu, so sánh sự khác biệt giữa các quốc gia và nêu bật xu hướng chính. Bài viết nên rõ ràng, có cấu trúc và sử dụng từ vựng chính xác.
Bạn có thể đọc lại bài nói về Task 1 tại đây: IELTS Writing Task 1 cần lưu ý những gì?
Bạn cũng có thể đọc thêm bài viết này vì đề bài này là IELTS Writing Task 1 biểu đồ Line Graph.
IELTS Writing Task 1 Line Graph: Waste collection
You should spent about 20 mintutes on this task
IELTS Writing Task 1 requires describing a chart showing the monthly waste collection in four countries in 2010. Candidates need to analyze the data, compare the differences between the countries, and highlight the main trends. The writing should be clear, well-structured, and use accurate vocabulary.
You should write at least 150 words.
| Tháng | Quốc gia A (tấn) | Quốc gia B (tấn) | Quốc gia C (tấn) | Quốc gia D (tấn) |
| Tháng 1 | 250 | 300 | 280 | 270 |
| Tháng 2 | 240 | 310 | 290 | 260 |
| Tháng 3 | 260 | 320 | 285 | 275 |
| Tháng 4 | 270 | 330 | 295 | 280 |
| Tháng 5 | 265 | 340 | 300 | 290 |
| Tháng 6 | 275 | 350 | 305 | 295 |
| Tháng 7 | 280 | 360 | 310 | 300 |
| Tháng 8 | 285 | 370 | 315 | 310 |
| Tháng 9 | 290 | 380 | 320 | 320 |
| Tháng 10 | 295 | 390 | 325 | 330 |
| Tháng 11 | 300 | 400 | 330 | 340 |
| Tháng 12 | 310 | 410 | 335 | 350 |

Bài tham khảo 1
Introduction
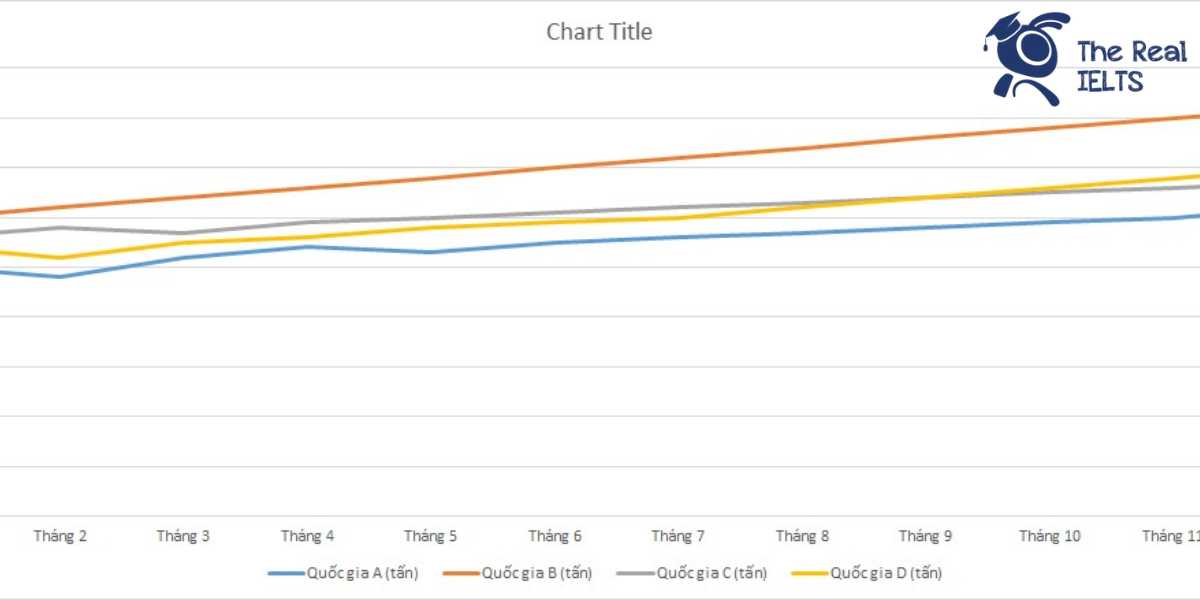
The line graph illustrates the monthly waste collection amounts in tons for four countries (A, B, C, and D) over the year 2010.
Overview
Overall, the quantity of waste collected increased steadily in all four countries throughout the year. Notably, Country B consistently collected the highest amount of waste, while Country A consistently had the lowest figures.
Body 1
In January, Country B collected the most waste at 300 tons, while Country A had the least at 250 tons. Throughout the year, all four countries showed an upward trend in waste collection. By June, Country B’s waste collection rose to 350 tons, an increase of 50 tons, while Country A’s waste collection reached 275 tons, a 25-ton increase. Country C and D also saw increases, with Country C rising from 280 to 305 tons and Country D from 270 to 295 tons.
Body 2
The upward trend continued in the latter half of the year. By December, Country B’s waste collection peaked at 410 tons, maintaining its position as the highest waste collector. Country A collected 310 tons, still the lowest but significantly higher than its January figure. Country C and D also followed similar patterns, ending the year at 335 and 350 tons, respectively. Overall, Country B’s consistent lead in waste collection and the steady increases in all four countries highlight the growing waste management challenges faced by these nations in 2010.
Bài tham khảo 2
The line graph illustrates the monthly waste collection data (in tons) for four countries (A, B, C, and D) throughout the year 2010.
Overall, it is clear that the amount of waste collected increased steadily in all four countries over the year. Country B consistently collected the most waste each month, while Country A collected the least. The trends for all countries were upward, with some fluctuations.
In the first half of the year, the amount of waste collected by each country showed a gradual increase. Country B started with the highest figure at 300 tons in January and rose to 350 tons by June. Country A began at 250 tons and reached 275 tons in June. Meanwhile, Country C and Country D followed similar patterns, starting at 280 and 270 tons respectively in January, and ending at 305 and 295 tons by June.
In the latter half of the year, the upward trend continued. By December, Country B’s waste collection had peaked at 410 tons, while Country A’s collection reached 310 tons. Country C and Country D also saw significant increases, with Country C ending the year at 335 tons and Country D at 350 tons. Notably, the largest monthly increase for Country B occurred between November and December, where it jumped from 400 to 410 tons.
In conclusion, while all four countries experienced a steady rise in waste collection over the year, Country B consistently collected the most waste, and Country A the least. The data suggests an overall growth in waste production across these nations in 2010.
Bài tham khảo 3
Introduction
The line graph illustrates the monthly amount of waste collected in four countries (A, B, C, and D) throughout the year 2010. The data is measured in tons and shows the trends in waste collection over the 12 months.
Overview
Overall, all four countries experienced an upward trend in waste collection over the year. Country B consistently had the highest waste collection, while Country A had the lowest. Countries C and D had relatively similar amounts of waste collected, with Country C slightly leading.
Body 1
In January, Country B collected 300 tons of waste, which was the highest among the four countries, followed by Country C with 280 tons, Country D with 270 tons, and Country A with 250 tons. By mid-year, in June, Country B’s waste collection had increased to 350 tons. During the same period, Countries A, C, and D collected 275, 305, and 295 tons respectively. This indicates a steady increase in waste collection for all countries.
Body 2
Towards the end of the year, the waste collection numbers continued to rise. By December, Country B reached its peak at 410 tons. Country C and D also saw significant increases, collecting 335 and 350 tons respectively. Country A, while still having the lowest collection, also saw a rise to 310 tons. These trends suggest a consistent growth in waste collection across all four countries, with Country B leading throughout the year.