IELTS Writing Task 1 yêu cầu mô tả biểu đồ lượt truy cập trang web hàng tháng của bốn trang web trong năm 2010. Thí sinh cần so sánh dữ liệu, nhận xét về xu hướng, sự biến động và sự khác biệt giữa các trang web. Bài viết cần rõ ràng, chính xác, và có cấu trúc logic.
Bạn có thể đọc lại bài nói về Task 1 tại đây: IELTS Writing Task 1 cần lưu ý những gì?
Bạn cũng có thể đọc thêm bài viết này vì đề bài này là IELTS Writing Task 1 biểu đồ Line Graph.
IELTS Writing Task 1 Line Graph: Web Traffic
You should spent about 20 mintutes on this task
IELTS Writing Task 1 requires describing the monthly web traffic chart of four websites in 2010. Candidates need to compare data, comment on trends, fluctuations, and differences between the websites. The writing must be clear, accurate, and logically structured.
You should write at least 150 words.
| Tháng | Trang web A | Trang web B | Trang web C | Trang web D |
| Tháng 1 | 1,200,000 | 950,000 | 1,100,000 | 1,400,000 |
| Tháng 2 | 1,250,000 | 970,000 | 1,150,000 | 1,420,000 |
| Tháng 3 | 1,300,000 | 990,000 | 1,200,000 | 1,440,000 |
| Tháng 4 | 1,350,000 | 1,020,000 | 1,250,000 | 1,460,000 |
| Tháng 5 | 1,400,000 | 1,050,000 | 1,300,000 | 1,480,000 |
| Tháng 6 | 1,450,000 | 1,080,000 | 1,350,000 | 1,500,000 |
| Tháng 7 | 1,500,000 | 1,100,000 | 1,400,000 | 1,520,000 |
| Tháng 8 | 1,550,000 | 1,130,000 | 1,450,000 | 1,540,000 |
| Tháng 9 | 1,600,000 | 1,160,000 | 1,500,000 | 1,560,000 |
| Tháng 10 | 1,650,000 | 1,200,000 | 1,550,000 | 1,580,000 |
| Tháng 11 | 1,700,000 | 1,230,000 | 1,600,000 | 1,600,000 |
| Tháng 12 | 1,750,000 | 1,250,000 | 1,650,000 | 1,620,000 |

Bài tham khảo 1
Introduction
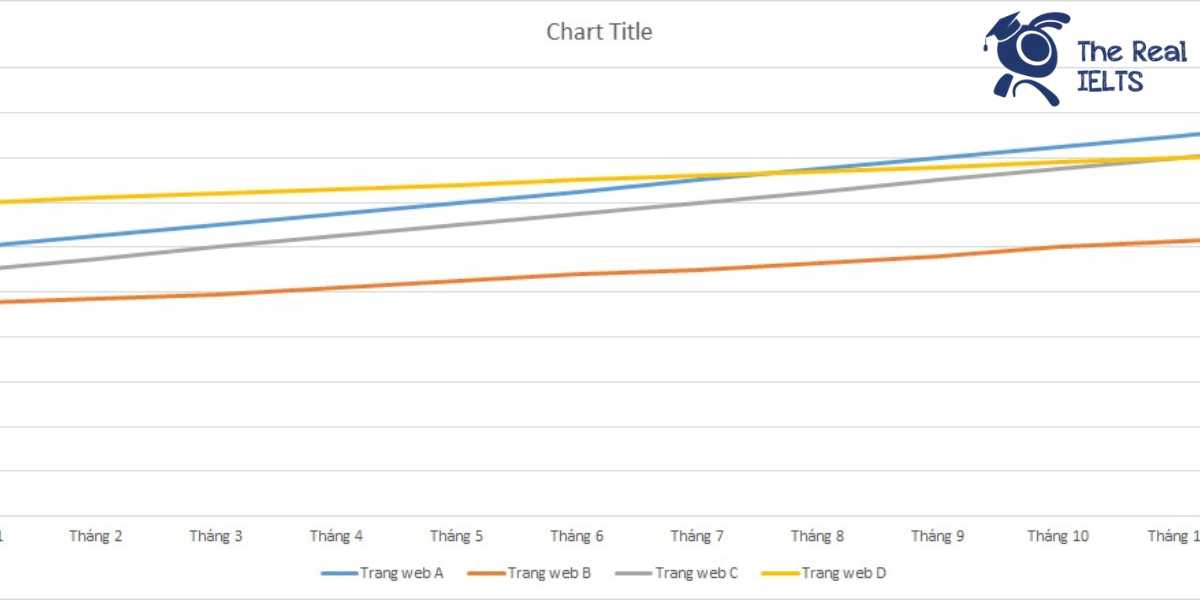
The line graph illustrates the monthly website visits of four different websites (A, B, C, and D) throughout the year 2010. The data is presented in thousands of visits.
Overview
Overall, all four websites experienced a steady increase in their number of monthly visits over the course of the year. Website D consistently had the highest number of visits each month, while Website B had the lowest number of visits. However, the gap between the websites’ visits gradually narrowed as the year progressed.
Body 1
At the beginning of the year, Website D had the most visits with 1.4 million in January, followed by Website A with 1.2 million, Website C with 1.1 million, and Website B with 950,000 visits. From January to June, all four websites saw a gradual increase in visits. By June, Website D had reached 1.5 million visits, Website A had 1.45 million, Website C had 1.35 million, and Website B had 1.08 million visits.
Body 2
The upward trend continued in the second half of the year. By December, Website D had 1.62 million visits, maintaining its lead. Website A closely followed with 1.75 million visits, showing the most significant growth. Website C also experienced substantial growth, ending the year with 1.65 million visits. Website B, although consistently the lowest, increased its visits to 1.25 million by December. Despite Website B’s lower numbers, the overall trend shows a consistent increase in monthly visits for all four websites.
Conclusion
In summary, while Website D maintained the highest number of visits throughout 2010, all four websites demonstrated a consistent increase in traffic, with Website A showing the most significant growth over the year.
Bài tham khảo 2
The line graph illustrates the monthly number of visits to four websites (A, B, C, and D) in 2010. The data is hypothetical and measures visits in millions.
Overall, the number of visits to all four websites showed an upward trend throughout the year. Website A consistently had the highest number of visits, followed by Website D, while Website B had the fewest visits each month.
In the first half of the year, Website A’s visits increased steadily from 1.2 million in January to 1.45 million in June. Similarly, Website C’s visits rose from 1.1 million to 1.35 million during the same period. Website D’s visits also showed an upward trajectory, climbing from 1.4 million in January to 1.5 million in June. Website B, despite having the fewest visits, increased gradually from 950,000 in January to 1.08 million in June.
In the second half of the year, the upward trend continued. Website A saw its visits rise from 1.5 million in July to 1.75 million in December, maintaining its lead. Website C also experienced a significant increase, ending the year at 1.65 million visits. Website D’s visits grew steadily, reaching 1.62 million by December. Website B’s visits, although lower than the others, continued to increase, peaking at 1.25 million in December.
In summary, all four websites experienced growth in their monthly visits throughout 2010, with Website A consistently leading in popularity and Website B having the lowest number of visits.
Bài tham khảo 3
Introduction
The line graph illustrates the monthly website visits of four different websites (A, B, C, and D) throughout the year 2010. The figures are given in terms of the number of visits.
Overview
Overall, it can be observed that all four websites experienced an upward trend in their monthly visits over the year. Among them, Website A had the highest increase, while Website B had the lowest number of visits throughout the year.
Body 1
At the beginning of the year, in January, Website D had the highest number of visits, starting at 1.4 million. In comparison, Website A had 1.2 million visits, Website C had 1.1 million, and Website B had the least, with 950,000 visits. As the year progressed, all four websites saw a steady increase in their visit numbers. By June, Website A had increased to 1.45 million visits, maintaining its lead, while Website D was close behind at 1.5 million. Website C and B recorded 1.35 million and 1.08 million visits respectively in the same month.
Body 2
In the latter half of the year, the upward trend continued for all websites. By December, Website A reached the peak at 1.75 million visits, showing the most significant growth among the four. Website D followed with 1.62 million visits. Website C and Website B also increased, reaching 1.65 million and 1.25 million visits respectively. Despite Website B having the lowest visits throughout the year, it still showed a consistent growth pattern.
In summary, while all websites experienced growth, Website A had the most substantial increase in visits over the year, and Website B, despite having the least number of visits, showed a steady rise.