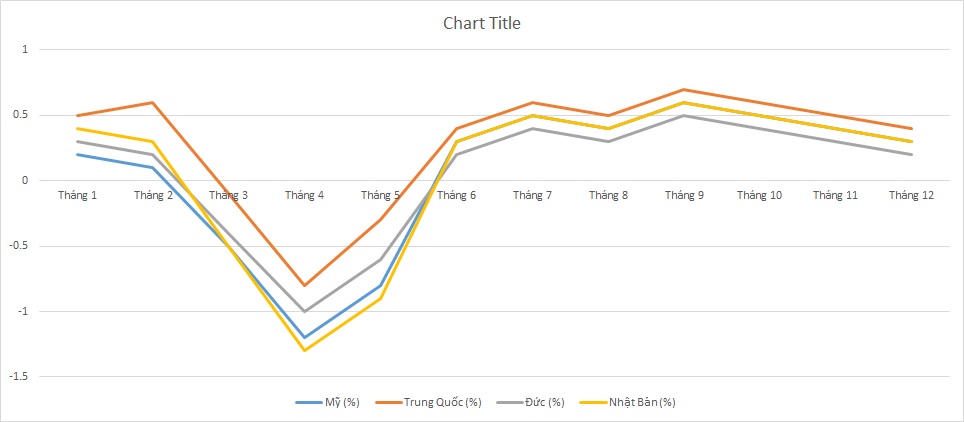
IELTS Writing Task 1 yêu cầu mô tả và phân tích biểu đồ về doanh số bán lẻ hàng tháng năm 2020 của bốn quốc gia. Người thi cần so sánh số liệu, xác định xu hướng chính, và đưa ra các điểm khác biệt đáng chú ý. Kỹ năng miêu tả số liệu một cách chính xác và logic là rất quan trọng.
Bạn có thể đọc lại bài nói về Task 1 tại đây: IELTS Writing Task 1 cần lưu ý những gì?
Bạn cũng có thể đọc thêm bài viết này vì đề bài này là IELTS Writing Task 1 biểu đồ Line Graph.
IELTS Writing Task 1 Line Graph: Retail Sales
You should spent about 20 mintutes on this task
IELTS Writing Task 1 requires describing and analyzing a chart about the monthly retail sales in 2020 of four countries. Test takers need to compare the data, identify main trends, and highlight notable differences. The skill of accurately and logically describing the data is very important.
You should write at least 150 words.
| Tháng | Quốc gia A (triệu USD) | Quốc gia B (triệu USD) | Quốc gia C (triệu USD) | Quốc gia D (triệu USD) |
| Tháng 1 | 25.0 | 30.5 | 28.0 | 32.5 |
| Tháng 2 | 24.5 | 29.8 | 27.5 | 31.8 |
| Tháng 3 | 23.0 | 28.0 | 25.0 | 30.0 |
| Tháng 4 | 22.0 | 27.5 | 24.5 | 29.0 |
| Tháng 5 | 24.0 | 29.0 | 26.5 | 31.0 |
| Tháng 6 | 25.5 | 30.8 | 28.2 | 33.2 |
| Tháng 7 | 26.0 | 31.5 | 28.8 | 34.0 |
| Tháng 8 | 27.0 | 32.0 | 29.5 | 35.0 |
| Tháng 9 | 26.5 | 31.8 | 29.2 | 34.8 |
| Tháng 10 | 27.5 | 32.5 | 30.0 | 35.5 |
| Tháng 11 | 28.0 | 33.0 | 30.5 | 36.0 |
| Tháng 12 | 29.0 | 34.0 | 31.0 | 37.0 |
Bài tham khảo 1
Introduction:
The table illustrates the monthly retail sales figures for four hypothetical countries (A, B, C, and D) in 2020, measured in millions of USD.
Overview:
Overall, it is evident that Country D consistently had the highest retail sales throughout the year, while Country A had the lowest sales in most months. All countries showed an upward trend in sales towards the end of the year.
Body 1:
In the first half of the year, Country A’s retail sales fluctuated between 22.0 million USD in April, the lowest point, and 25.5 million USD in June. Country B showed a similar trend, with sales dipping to 27.5 million USD in April before rising to 30.8 million USD in June. Country C’s sales followed a downward trend until April, reaching a low of 24.5 million USD, and then started to recover, reaching 28.2 million USD in June. Country D maintained the highest sales, peaking at 33.2 million USD in June.
Body 2:
In the second half of the year, all four countries saw an increase in retail sales. Country A’s sales rose steadily, peaking at 29.0 million USD in December. Country B’s sales increased to 34.0 million USD by December. Country C experienced a consistent rise, ending the year at 31.0 million USD. Country D continued to dominate with the highest sales, reaching a peak of 37.0 million USD in December. This overall upward trend indicates a positive growth in retail sales across all four countries towards the end of 2020.
Bài tham khảo 2
The table provides information on the monthly retail sales of four hypothetical countries in 2020, measured in million USD.
Overview:
Overall, Country D consistently had the highest retail sales throughout the year, while Country A had the lowest. There was a general upward trend in retail sales for all four countries from January to December.
Body 1:
In the first half of the year, retail sales in all four countries showed a slight decline initially but then started to recover. Country A’s sales decreased from 25.0 million USD in January to 22.0 million USD in April before rising to 25.5 million USD in June. Similarly, Country B’s sales fell from 30.5 million USD in January to 27.5 million USD in April, then increased to 30.8 million USD by June. Country C and Country D followed similar patterns, with sales dipping in March and April before recovering by June, reaching 28.2 million USD and 33.2 million USD, respectively.
Body 2:
In the second half of the year, all four countries experienced continuous growth in retail sales. Country A’s sales rose from 26.0 million USD in July to 29.0 million USD in December. Country B saw an increase from 31.5 million USD to 34.0 million USD over the same period. Country C’s sales went from 28.8 million USD in July to 31.0 million USD in December. Country D maintained the highest sales throughout the year, peaking at 37.0 million USD in December. This steady increase highlights a strong recovery and growth trend across all countries during the latter part of the year.
Bài tham khảo 3
The table provides a breakdown of monthly retail sales in 2020 for four hypothetical countries: A, B, C, and D, measured in million USD.
Overview:
Overall, the data shows that retail sales in all four countries followed an upward trend over the year. Country D consistently had the highest sales figures each month, while Country A had the lowest.
Body 1:
In January, Country D recorded the highest retail sales at 32.5 million USD, followed by Country B at 30.5 million USD, Country C at 28.0 million USD, and Country A at 25.0 million USD. A gradual decline in sales was observed in February and March for all countries. By April, the sales figures reached their lowest points for the year, with Country D at 29.0 million USD, Country B at 27.5 million USD, Country C at 24.5 million USD, and Country A at 22.0 million USD.
Body 2:
Starting from May, retail sales began to recover. By June, Country D’s sales rose to 33.2 million USD, Country B’s to 30.8 million USD, Country C’s to 28.2 million USD, and Country A’s to 25.5 million USD. The upward trend continued for the rest of the year, culminating in December when Country D reached 37.0 million USD, Country B 34.0 million USD, Country C 31.0 million USD, and Country A 29.0 million USD. This consistent increase indicates a robust recovery in the retail sector across all four countries.